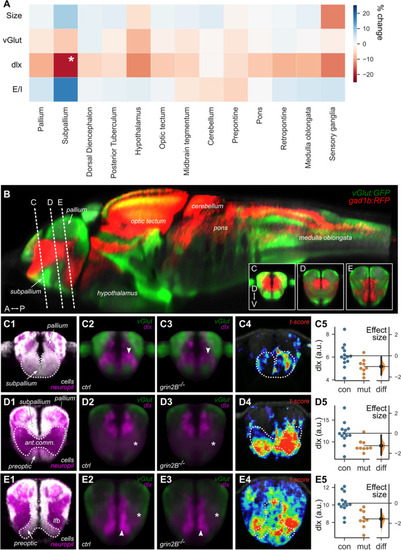
Whole-brain imaging of zebrafish lacking GluN2B reveal a reduced inhibitory neuron signal in the subpallium. A Heat map of the ratio of size, transgenic expression of excitatory (vGlut) and inhibitory (dlx) marker, and calculated excitatory/inhibitory balance (E/I) for grin2B control (n = 13) and grin2B−/− (n = 9) larvae. Values are shown as the percent increase in the signal grin2B−/− larvae compared to grin2B control. (*p = 0.022, independent-samples t test). B Reconstructed sagittal section from the Zebrafish Brain Browser (ZBB) showing the distribution of glutamatergic (green) and GABAergic (red) neurons in the larval brain. Planes through which coronal sections were reconstructed for panels C–E are indicated. Anterior (A), posterior (P), dorsal (D), ventral (V). In Panel B, C1, D1, and E1 were generated using the Zebrafish Brain Browser. Subpanels 2–4 from (C–E) were generated using data acquired from dlx:GFP larvae. C–E Coronal sections through parts of the subpallium, including the anterior cell-rich domain (C), anterior commissure (D), and preoptic region (E). Subpanel 1: distribution of cell-rich (white) and neuropil-rich (magenta) zones (ZBB). Subpanels 2–3: mean confocal signal in grin2B control and grin2B−/− larvae, for excitatory (Tg(vglut:DsRed); green) and inhibitory (Tg(dlx6a-1.4kbdlx5a/dlx6a:GFP); magenta) neurons. Subpanel 4: spatial locations of voxel-level normalized differences (t-score) between the inhibitory signal in grin2B control and grin2B−/− larvae. Subpanel 5: Estimation plots showing mean intensity of the inhibitory signal per fish, for regions encompassing the anterior subpallium (C, p = 0.015), anterior commissure (D, p = 0.0038), and preoptic region (E, p = 0.0011) for grin2B control (blue) and grin2B−/− (orange) larvae. Right axes show effect sizes for differences
|
