
Fig. 4
- ID
- ZDB-IMAGE-220926-12
- Publication
- Zoodsma et al., 2022 - Disruption of grin2B, an ASD-associated gene, produces social deficits in zebrafish
- All Figures
- Figures for Zoodsma et al., 2022
|
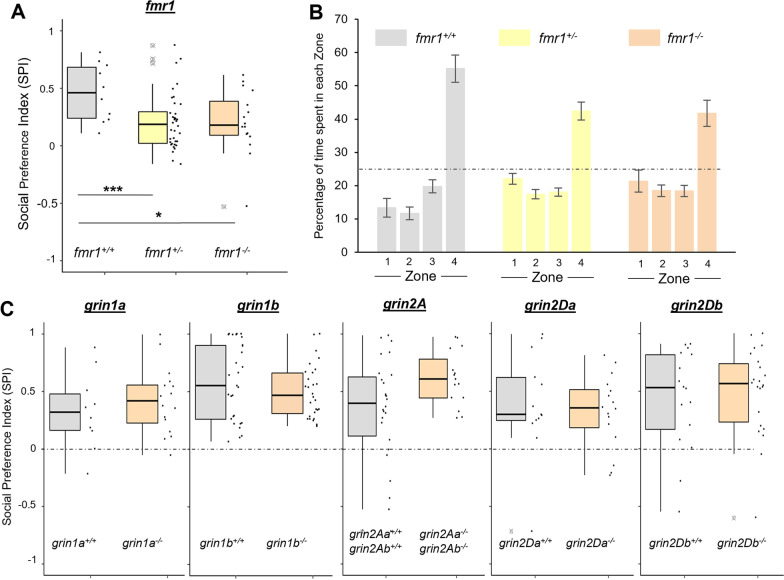
Fig. 4
Zebrafish lacking fmr1, but not other NMDAR subunits, show a social preference deficit at 3 wpf. A SPI from a 3 wpf assay on fish lacking fmr1. Experimental details in Additional file 1: Table S4. B Bar graph (mean ± SEM) outlining mean time spent in each of the zone subdivisions for each fmr1 genotype at 3 wpf. Dashed line is at 25%, the value of no preference for any zone. Zone 4 is the region closest to the conspecific. C SPI from 3 wpf assays of zebrafish lacking grin1a, grin1b, grin2A, grin2Da, and grin2Db. Dashed line is at 0, the value of no preference in SPI. Experimental details in Additional file 1: Table S4