
- Title
-
Resolving primary pathomechanisms driving idiopathic-like spinal curvature using a new katnb1 scoliosis model
- Authors
- Meyer-Miner, A., Van Gennip, J.L.M., Henke, K., Harris, M.P., Ciruna, B.
- Source
- Full text @ iScience
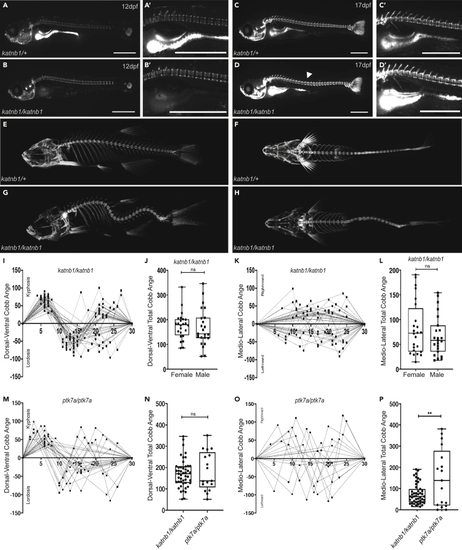
(A–D) Representative lateral views of calcein-stained (E–H) Three dimensional microCT projections of representative 3-month-old (I–L) Quantification of curve severity, direction, and position along the DV (I, J) and ML (K, L) axes of (M and O) Quantification of curve severity, direction, and position along the DV (M) and ML (O) axes of (N and P) Quantification of curve severity as a measure of total Cobb angle, comparing |
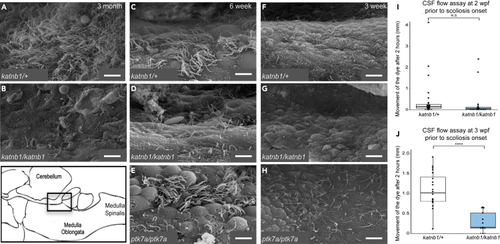
(A–H) SEM imaging of the rhombencephalic ventricle in brains dissected from 3-month-old (I and J) Quantification of bulk CSF movement as measured by the distance fluorescent dye travels along the spinal canal (in millimeters; mm), 2 h post-injection into the brain ventricles of experimental fish. (I) PHENOTYPE:
|
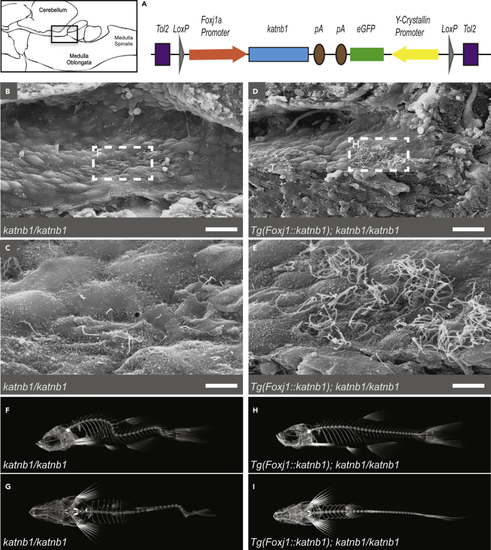
Re-introduction of Katnb1 in (A) Schematic of (B–E) SEM images of the rhombencephalic ventricle of 3 month old (F–I) Representative microCT projections of 3-month-old PHENOTYPE:
Construct:
Tg(LOXP-foxj1a:katnb1,cryaa:EGFP-LOXP)
|
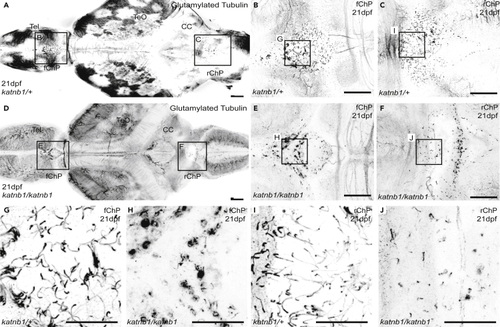
(A–F) Representative maximum intensity Z-stack projections of confocal micrographs, acquired through dorsally oriented whole mount brains that were dissected from 21dpf (G–J) Higher magnification regions (as indicated in B, C, E & F) of cilia on the forebrain ChP (G & H) and rhombencephalic ChP (I & J) of PHENOTYPE:
|
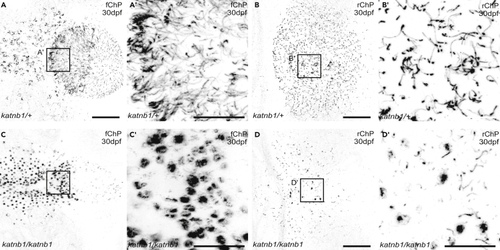
(A–D) Representative maximum intensity Z-stack projections of confocal micrographs, acquired through dorsally oriented whole mount brains that were dissected from 30 dpf PHENOTYPE:
|
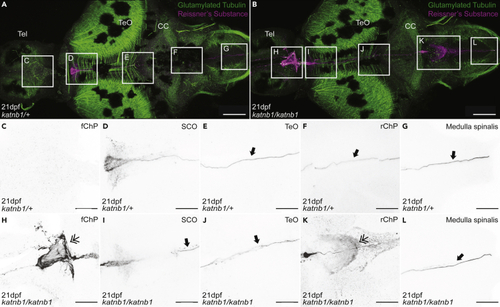
Analysis of Sspo localization and RF formation in 21dpf (A–L) Representative maximum intensity Z-stack projections of confocal micrographs, acquired through dorsally oriented whole mount brains that were dissected from 21dpf PHENOTYPE:
|
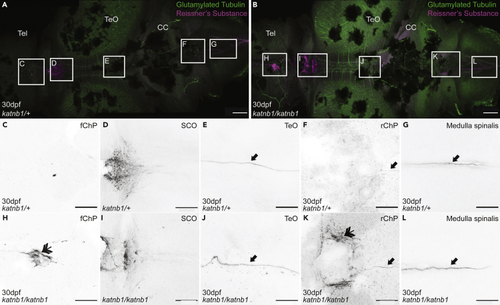
Analysis of Sspo localization and RF formation in 30dpf (A–L) Representative maximum intensity Z-stack projections of confocal micrographs, acquired through dorsally oriented whole mount brains that were dissected from 21dpf PHENOTYPE:
|
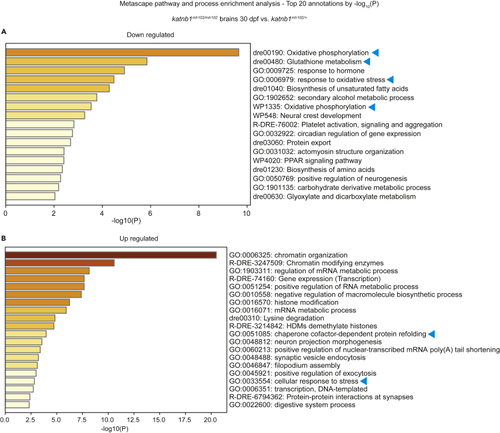
Metascape enrichment analysis of differentially expressed genes in (A and B) Metascape pathway enrichment analysis using the |

ZFIN is incorporating published figure images and captions as part of an ongoing project. Figures from some publications have not yet been curated, or are not available for display because of copyright restrictions. PHENOTYPE:
|