FIGURE

Figure 7

ID
ZDB-FIG-220920-33
Publication
Meyer-Miner et al., 2022 - Resolving primary pathomechanisms driving idiopathic-like spinal curvature using a new katnb1 scoliosis model
Other Figures
All Figure Page
Back to All Figure Page
Figure 7

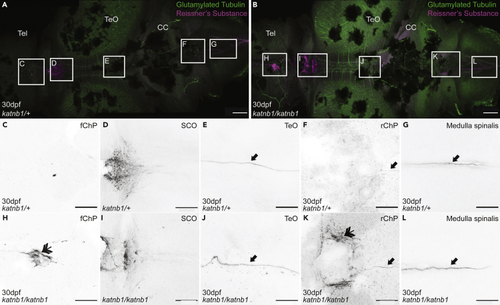
Analysis of Sspo localization and RF formation in 30dpf katnb1 mutant brains

(A–L) Representative maximum intensity Z-stack projections of confocal micrographs, acquired through dorsally oriented whole mount brains that were dissected from 21dpf katnb1mh102/+ control (A, C–G; N = 9, n = 61) and katnb1mh102/mh102 mutant (B, H–L; N = 12, n = 82) fish, and immunostained for polyglutamylated tubulin (green) and Sspo (magenta). Squares indicate regions of interest, chosen for higher magnification analyses of areas surrounding the fChP (C, H); SCO (D, I); TeO (E, J); rChP (F, K); and medulla spinalis (G, L). (C–L) Inverted, higher magnification images of Sspo immunostaining. (C–G) katnb1mh102/+ control animals exhibit normal Sspo localization and RF is present (arrows). (H–L) katnb1mh102/mh102 mutant images, exhibiting abnormal Sspo accumulation at the fChP and rChP (double arrowheads), and the presence of an intact RF (arrows). Scale bars, 100 μm (A & B) and 50 μm (C–L).

Expression Data

Expression Detail
Antibody Labeling
Phenotype Data
Fish:
Observed In:
Stage: Days 30-44

Phenotype Detail
Acknowledgments
This image is the copyrighted work of the attributed author or publisher, and ZFIN has permission only to display this image to its users. Additional permissions should be obtained from the applicable author or publisher of the image. Full text @ iScience