FIGURE

Figure 1

ID
ZDB-FIG-220920-26
Publication
Meyer-Miner et al., 2022 - Resolving primary pathomechanisms driving idiopathic-like spinal curvature using a new katnb1 scoliosis model
Other Figures
All Figure Page
Back to All Figure Page
Figure 1

katnb1 mutant zebrafish exhibit defining attributes of IS

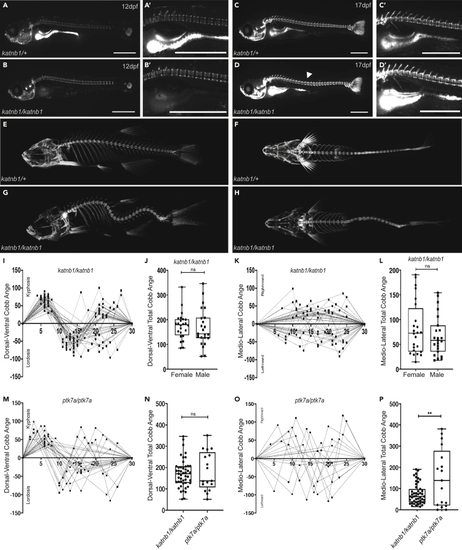
(A–D) Representative lateral views of calcein-stained katnb1mh102/+ (A & A’; N = 2, n = 24) and katnb1mh102/mh102 (B & B’; N = 2, n = 13) fish at 12 dpf (6 mm average length); and of katnb1mh102/+ (C & C’; N = 4, n = 53) and katnb1mh102/mh102 (D & D’; N = 4, n = 18) fish at 17 dpf (7 mm average length). Note onset of spinal curvatures in katnb1mh102/mh102 zebrafish (arrowheads) in the absence of congenital vertebral malformations. Squares indicate location of higher magnification images (A′–D′). Scale bars, 1 mm.

(E–H) Three dimensional microCT projections of representative 3-month-old katnb1mh102/+ (E & F; N = 2, n = 5) and katnb1mh102/mh102 (G & H; N = 17, n = 68) zebrafish viewed in sagittal (E & G) and coronal (F & H) planes.

(I–L) Quantification of curve severity, direction, and position along the DV (I, J) and ML (K, L) axes of katnb1mh102/mh102 mutant zebrafish. (I, K) Graphs depicting spinal curvatures of individual mutant fish: x axis indicates vertebral position of curve apices along the rostral to caudal plane; Y axis indicates magnitude of curvature (Cobb angle). Positive Cobb angles represents kyphotic curves in the DV axis and rightward curves in the ML axis. Negative Cobb angle represents lordotic curves in the DV axis and leftward curves in the ML axis. (J, L) Graphs depicting sums of all Cobb angle measurements in DV (J, p = 0.72) and ML (L, p = 0.31) axes for male and female katnb1mh102/mh102 fish (N = 6, n = 47). Statistical analyses were performed using student’s t test.

(M and O) Quantification of curve severity, direction, and position along the DV (M) and ML (O) axes of ptk7ahsc9/hsc9 mutant zebrafish.

(N and P) Quantification of curve severity as a measure of total Cobb angle, comparing katnb1mh102/mh102 (N = 17, n = 68) and ptk7ahsc9/hsc9 (N = 8, n = 17) mutant animals along the DV (N, p = 0.613) and ML (P, p = 0.0014) axis.

Expression Data

Expression Detail
Antibody Labeling
Phenotype Data
Fish:
Observed In:
Stage Range: Days 7-13 to Adult

Phenotype Detail
Acknowledgments
This image is the copyrighted work of the attributed author or publisher, and ZFIN has permission only to display this image to its users. Additional permissions should be obtained from the applicable author or publisher of the image. Full text @ iScience