IMAGE

Figure 6

ID
ZDB-IMAGE-220920-35
Source
Figures for Meyer-Miner et al., 2022
Image
Figure Caption

Figure 6

Analysis of Sspo localization and RF formation in 21dpf katnb1 mutant brains

(A–L) Representative maximum intensity Z-stack projections of confocal micrographs, acquired through dorsally oriented whole mount brains that were dissected from 21dpf
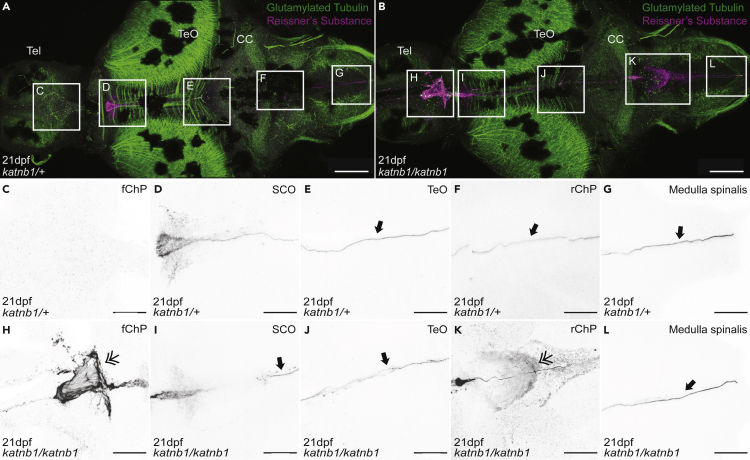
 katnb1mh102/+ control (A, C–G; N = 7, n = 54) and katnb1mh102/mh102 mutant (B, H-L; N = 7, n = 36) fish, and immunostained for polyglutamylated tubulin (green) and Sspo (magenta). Squares indicate regions of interest, chosen for higher magnification analyses of areas surrounding the fChP (C, H); subcommisural organ (SCO; D, I); optic tectum (TeO; E, J); rChP (F, K); and medulla spinalis (G, L). (C–L) Inverted, higher magnification images of Sspo immunostaining. (C–G) Normal Sspo localization is observed in katnb1mh102/+ control animals, including the presence of a RF (arrows). (H–L) katnb1mh102/mh102 mutant images, exhibiting abnormal Sspo accumulation at the fChP and rChP (double arrowheads), and the presence of a RF (arrows). Scale bars, 100 μm (A & B) and 50 μm (C–L).

Figure Data
Acknowledgments
This image is the copyrighted work of the attributed author or publisher, and ZFIN has permission only to display this image to its users. Additional permissions should be obtained from the applicable author or publisher of the image. Full text @ iScience