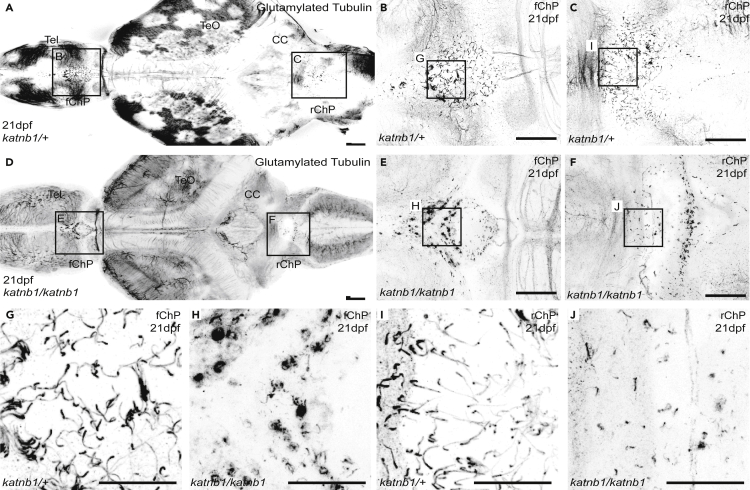
IMAGE

Figure 4

ID
ZDB-IMAGE-220920-33
Source
Figures for Meyer-Miner et al., 2022
Image
Figure Caption

Figure 4

katnb1 mutants exhibit choroid plexus cilia defects at 21 dpf

(A–F) Representative maximum intensity Z-stack projections of confocal micrographs, acquired through dorsally oriented whole mount brains that were dissected from 21dpf katnb1mh102/+ (A; N = 6, n = 14) and katnb1mh102/mh102 (D; N = 6, n = 25) fish, and immunostained for polyglutamylated tubulin. Squares indicate regions of interest, chosen for higher magnification analyses of the forebrain ChP (B & E) and rhombencephalic ChP (C & F) of katnb1mh102/+ control (B & C; N = 8, n = 60) and katnb1mh102/mh102 mutant (E & F; N = 8, n = 32) animals. Scale bars, 50 μm. Tel: telencephalon, TeO: optic tectum, CC: cerebellum.

(G–J) Higher magnification regions (as indicated in B, C, E & F) of cilia on the forebrain ChP (G & H) and rhombencephalic ChP (I & J) of katnb1mh102/+ control (G & I) and katnb1mh102/mh102 mutant (H & J) brains. Scale bars, 25 μm.

Figure Data
Acknowledgments
This image is the copyrighted work of the attributed author or publisher, and ZFIN has permission only to display this image to its users. Additional permissions should be obtained from the applicable author or publisher of the image. Full text @ iScience