
- Title
-
Transgenic Overexpression of Myocilin Leads to Variable Ocular Anterior Segment and Retinal Alterations Associated with Extracellular Matrix Abnormalities in Adult Zebrafish
- Authors
- Atienzar-Aroca, R., Ferre-Fernández, J.J., Tevar, A., Bonet-Fernández, J.M., Cabañero, M.J., Ruiz-Pastor, M.J., Cuenca, N., Aroca-Aguilar, J.D., Escribano, J.
- Source
- Full text @ Int. J. Mol. Sci.
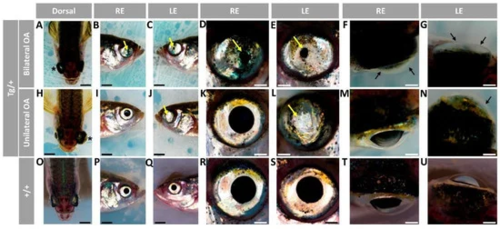
Figure 1. Variable ocular phenotypes in old (two-year-old) transgenic myoc zebrafish. Brightfield images of representative male myoc transgenic zebrafish with (A–G) bilateral or (H–N) unilateral ocular alterations. (O–U) A wild-type zebrafish of the same age is shown as a control. Yellow arrows: iris overgrowth and reduced or absent pupil; black arrows: cloudy corneas and reduced anterior chamber size; asterisk: enlarged eyeballs; scale bar in panels (A–C, H–J, and O–Q): 200 μm; scale bar in panels. (D–G, K–N, and R–U): 50 μm. LE: left eye. OA: ocular alterations; RE: right eye. Tg/+: transgenic. +/+: wild type.
PHENOTYPE:
|
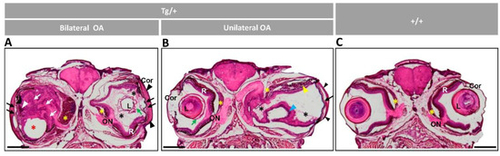
Figure 2. Histology of head sections of adult male transgenic zebrafish (two years old). Hematoxylin-eosin-stained tissue sections of transgenic zebrafish with (A) bilateral or (B) unilateral macroscopic ocular alterations. (C) Control tissue sections from wild-type zebrafish of the same age and sex. Black arrows: contacts between iris and cornea; black arrowheads: increased thickness of the corneal stroma; black asterisks: increased vitreous-like material; green arrows: folded and thickened lens capsule; blue arrowhead: overgrowth and folding of the retina; red asterisk: displaced lens: white arrows: hypertrophy of the retinal fiber layer and optic nerve; yellow arrowheads: abnormal photoreceptors; yellow asterisks: overgrowth of the choroid body. Scale bar: 800 µm. Cor: cornea; OA: ocular alterations; ON: optic nerve; L: lens; R: retina; +/+: wild type; Tg/+: transgenic.
PHENOTYPE:
|
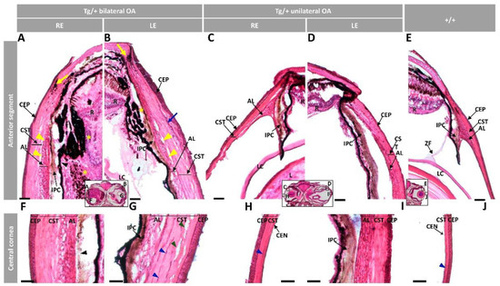
Figure 3. Histology of ocular anterior segment from old (two-year-old) myoc transgenic zebrafish. Hematoxylin-eosin-stained tissue sections of transgenic zebrafish with (A,B,F,G) bilateral or (C,D,H,I) unilateral macroscopic ocular alterations. (E,J) Control tissue sections from wild-type zebrafish of the same age and sex. Head tissue sections in the inserts indicate the localization of the images shown in the different panels. Scale bars: 50 µm. The images are representative of two individuals of each genotype. AL: annular ligament; CEN: corneal endothelium; CEP: corneal epithelium; CST: corneal stroma; R: retina; IPC: iris pigment cells; L: lens; LC: lens capsule; LE: left eye; OA: ocular alterations; RE: right eye; ZF: zonular fiber; black arrowhead: close contact between the hypertrophic annular ligament and iris; blue arrow: collagen cords; blue arrowheads: cavities in the CST; green arrowhead: keratocytes; yellow arrows: limbal melanocytes; yellow arrowheads: cavities between IPC and AL; yellow asterisk: increased RPE cells; Tg/+: transgenic; +/+: wild type.
PHENOTYPE:
|
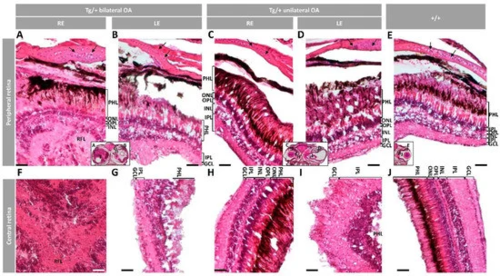
Figure 4. Histology of retinas from old (two-year-old) male myoc transgenic zebrafish. Tissue sections were stained with hematoxylin-eosin. Variable retinal disorganization and dysplasia, ranging from (A,F) the presence of a neuroretinal mass to (B,D,G,I) different degrees of photoreceptor degeneration and increased number of nuclei in different layers or (C,H) no evident alterations. Control wild type retina (E,J). Head tissue sections in the inserts indicate the localization of the images shown in the different panels. The images are representative of two individuals per phenotype. Arrows: chondrocytes in the scleral cartilage. Scale bars: 50 μm. Only clearly identifiable retinal layers are indicated. GCL: ganglion cell layer; IPL: inner plexiform layer; INL: inner nuclear layer; LE: left eye; OA: ocular alterations; OPL: outer plexiform layer; ONL; outer nuclear layer; PHL: photoreceptor layer; RE: right eye; RFL: retinal fiber layer; Tg/+: transgenic; +/+: wild type.
PHENOTYPE:
|
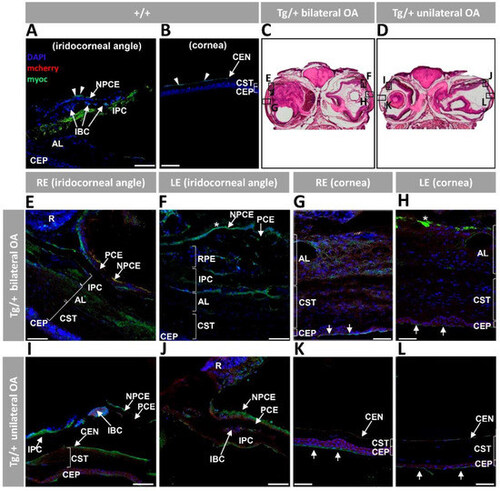
Figure 5. Fluorescent immunohistochemistry expression analysis of myocilin and mCherry in the anterior segment of old (two years) myoc transgenic zebrafish. A chicken anti-myocilin primary antibody was used to detected myocilin (green signal). Control wild type iridocorneal angle (A) and cornea (B). Representative head sectionsindicate the regions analyzed by immunohistochemistry in transgenic zebrafish with bilateral (C) or unilateral (D) ocular alterations. Anterior segment tissue sections from zebrafish with bilateral (E–H) or unilateral (I–L) ocular alterations. Asterisk in (F,H): myocilin immunoreactivity in the vitreous and iris stroma, respectively. Arrows in (G,H,K,L): myocilin immunoreactivity in the most superficial layer of the corneal epithelium. Scale bars: 50 μm; AL: annular ligament; CEN: corneal endothelium; CEP: corneal epithelium; CST: corneal stroma; IBC: iris blood cells; IPC; iris pigment cells; LE: left eye; NPCE: non-pigmented ciliary epithelium; OA: ocular alterations; PCE: pigmented ciliary epithelium; R: retina; RE: right eye; RPE: retinal pigment epithelial cells; +/+: wild type; Tg/+: transgenic.
|
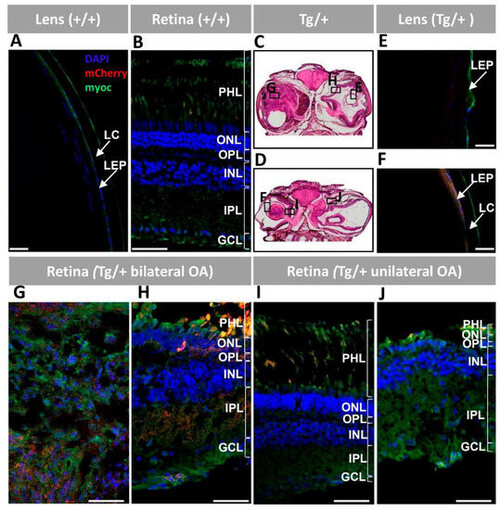
Figure 6. Fluorescent immunohistochemistry expression analysis of myocilin and mCherry in the lens and retina of old (two-year-old) myoc transgenic zebrafish. A chicken anti-myocilin primary antibody was used to detected myocilin (green signal). Control wild type lens (A) and retina (B). Representative head tissue sections in panels (C,D) indicate the regions analyzed by immunohistochemistry in transgenic zebrafish with bilateral (C) or unilateral (D) ocular alterations. Lens (E,F) and retina (G–J) tissue sections. Scale bars: 50 μm. GCL: ganglion cell layer; IPL: inner plexiform layer; INL: inner nuclear layer; LC: lens capsule; LEP: lens epithelium; OA: ocular alterations; OPL: outer plexiform layer; ONL; outer nuclear layer; PHL: photoreceptor layer; +/+: wild type; Tg/+: transgenic.
|
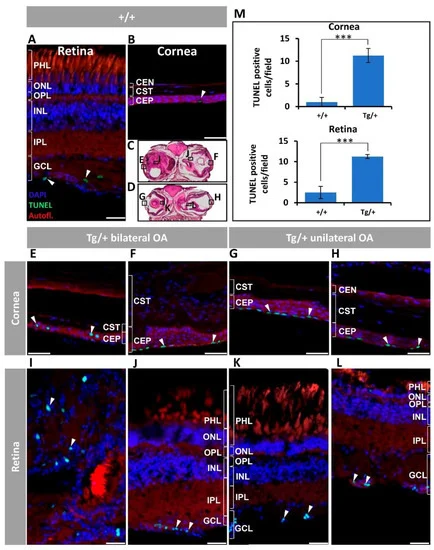
Figure 7. Corneal epithelium and retinal ganglion cell apoptosis in old (two-year-old) myoc transgenic zebrafish. Apoptosis was assessed using terminal dUTP nick-end labelling (TUNEL) of fragmented DNA. (A) Wild-type retina and (B) cornea. (C,D) Representative transgenic head tissue sections indicate the regions analyzed by immunohistochemistry. (E–H) transgenic cornea. (I–L) Transgenic retina. Scale bar in (A,I–L): 25 μm. Scale bar in (B,E–H): 50 μm. (M) Quantification of TUNEL positive cells. Four microscopic fields per eye were analyzed (n = four eyes). ***: p < 0.001, Student’s t-test. White arrowheads: TUNEL-positive cells. Autofl.: tissue autofluorescence used for image contrast and anatomical reference. CEP: corneal epithelium; CST: corneal stroma; CEN: corneal endothelium; GCL: ganglion cell layer; IPL: inner plexiform layer; INL: inner nuclear layer; OA: ocular alterations; OPL: outer plexiform layer; ONL; outer nuclear layer; PHL: photoreceptor layer; Tg/+: transgenic; +/+: wild type. The images are representative of the results observed in two fishes of each genotype.
PHENOTYPE:
|
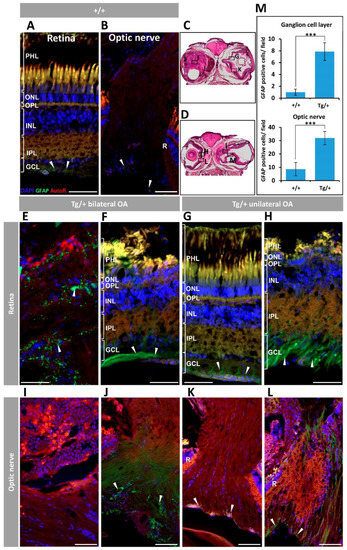
Figure 8. Retinal and optic nerve gliosis in old (two years) myocilin transgenic zebrafish. A rabbit anti-GFAP primary antibody was used to detected Müller glial cells. (A) Wild-type retina and (B) optic nerve. (C,D) Representative transgenic head tissue sections indicating the regions analysed by immunohistochemistry. (E–H) Transgenic retina. (I–L) Transgenic optic nerve. (M) Quantification of GFAP-positive cells in the ganglion cell layer and optic nerve. Four microscopic fields per eye were analyzed (n = four eyes). ***: p < 0.001, Student’s t-test. Arrowheads: GFAP labelling of Müller cells. Scale bars: 50 μm. Autofl.: tissue autofluorescence used for image contrast and anatomical reference; GCL: ganglion cell layer; IPL: inner plexiform layer; INL: inner nuclear layer; OA: ocular alterations; OPL: outer plexiform layer; ONL; outer nuclear layer; PHL: photoreceptor layer; R: retina. Tg/+: transgenic; +/+: wild type. The images are representative of the results observed in two zebrafish of each type.
|

Figure 9. Increased number of retinal ganglion cells in the retinal mass present in the most severe phenotype of old (two-year-old) myocilin transgenic zebrafish. Overview and detailed images of (A,B) wild-type zebrafish eye and (C–F) myocilin transgenic zebrafish eye. Images in (B,D,F) are details indicated by white boxes in (A,C,E), respectively. (A,B) Double immunostaining for calretinin (CR), a calcium-binding protein, and the transcription factor Brn3a was used for the identification of ganglion cells (arrowheads). Optic nerve fibers were immuno-positive for calretinin. TO-PRO-3-iodide was used for nuclei staining. (C–F) Asterisks: axon bundles. Scale bars in (A,C,E): 200 µm; scale bars in (B,D,F): 20 µm. ONL: outer nuclear layer; OPL: outer plexiform layer; INL: inner nuclear layer; IPL: inner plexiform layer; GCL: ganglion cell layer; NFL: nerve fiber layer; Tg/+: transgenic; +/+: wild type.
|
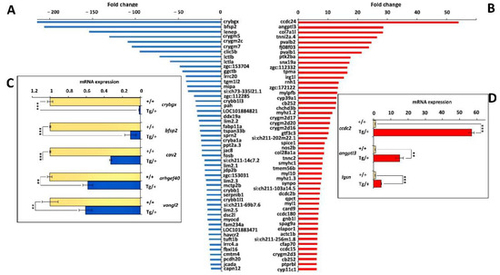
Figure 10. Top-50 DEGs in altered eyes of old (two-year-old) male myoc transgenic zebrafish. (A) Down- and (B) up-regulated genes identified by high-throughput RNA sequencing with significant differences coinciding in the comparison with the two wild-type ocular transcriptomes (Tg/+ OA vs. +/+1 and Tg/+ OA vs. +/+2). Confirmation by qRT-PCR of differential gene expression of selected (C) down- and (D) up-regulated genes. Aliquots of RNA preparations used for transcriptomic analyses were used as templates in qRT-PCR. Values represent the average of six experimental replicas. **: p < 0.01; ***: p < 0.001, Student’s t-test.
|
|
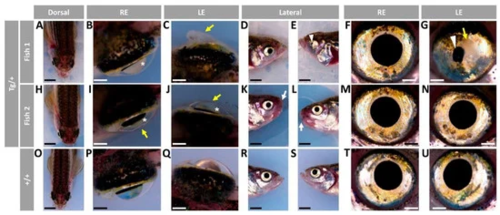
Figure 11. Variable ocular phenotypes in adult (13-month-old) F4 transgenic myoc zebrafish. Brightfield images of (A–N) representative myoc F4 transgenic male zebrafish with ocular alterations and (O–U) wild-type as a control. Asterisks: cloudy corneas; yellow arrows: corneal hyperplasia; white arrowhead: reduced pupil size. Scale bars in (A,D,E,H,K,L,O,R,S): 200 μm; Scale bars in (B,C,F,G,I,J,M,N,P,Q,T,U): 50 μm; LE: left eye; RE: right eye; Tg/+: transgenic; +/+: wild type.

PHENOTYPE:
|
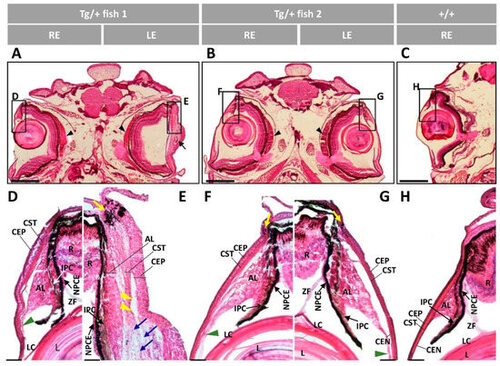
Figure 12. Histology of the anterior ocular segment of F4 adult male transgenic zebrafish (13 months). Tissue sections were stained with hematoxylin-eosin. Scale bars in (A–C): 800 µm. Scale bars in (D–H): 50 µm. The images are representative of five transgenic zebrafish. AL: annular ligament; CEP: corneal epithelium; CST: corneal stroma; CEN: corneal endothelium; R: retina; IPC: iris pigment cells; L: lens; LC: lens capsule; NPCE: nonpigmented ciliary; ZF: zonular fiber; LE: left eye; RE: right eye; Tg/+: transgenic; +/+: wild type; black arrow: deposit of amorphous material; black arrowheads: enlarged choroid body; blue arrows: increased keratocytes; green arrowhead: altered annular ligament: yellow arrows: limbal melanocytes; yellow arrowheads: cavities between the AL and CST.
|
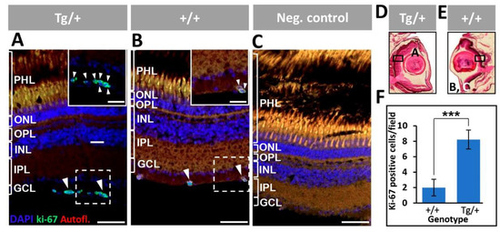
Figure 13. Proliferation of retinal ganglion cells in adult (13-month-old) myocilin transgenic zebrafish. (A,B) An anti-Ki-67 primary antibody was used to detect proliferating cells. Digital magnification of the positive cells indicted with white dotted boxes are shown in the inserts. (C) The negative control consisted of tissue sections incubated only with the secondary antibody. (D,E) Black rectangles in two representative eye sections indicate the location of microscopic fields shown in the different panels. (F) Quantification of Ki-67-positive cells. Four microscopic fields per eye were analyzed (n = four eyes). ***: p < 0.001, Student’s t-test. Scale bars: 50 μm. Arrowheads: Ki-67-positive cells. Scale bars: 50 μm. GCL: ganglion cell layer; IPL: inner plexiform layer; INL: inner nuclear layer; OPL: outer plexiform layer; ONL: outer nuclear layer; PHL: photoreceptor layer. The images are representative of the results observed in two fishes of each genotype.
PHENOTYPE:
|

ZFIN is incorporating published figure images and captions as part of an ongoing project. Figures from some publications have not yet been curated, or are not available for display because of copyright restrictions. PHENOTYPE:
|