
Image
|
Figure Caption
Fig. 7
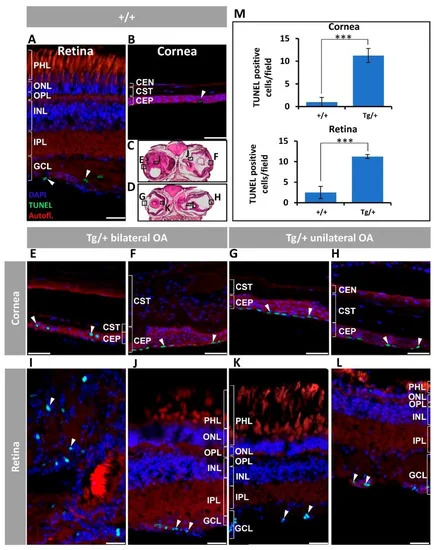
Figure 7. Corneal epithelium and retinal ganglion cell apoptosis in old (two-year-old) myoc transgenic zebrafish. Apoptosis was assessed using terminal dUTP nick-end labelling (TUNEL) of fragmented DNA. (A) Wild-type retina and (B) cornea. (C,D) Representative transgenic head tissue sections indicate the regions analyzed by immunohistochemistry. (E–H) transgenic cornea. (I–L) Transgenic retina. Scale bar in (A,I–L): 25 μm. Scale bar in (B,E–H): 50 μm. (M) Quantification of TUNEL positive cells. Four microscopic fields per eye were analyzed (n = four eyes). ***: p < 0.001, Student’s t-test. White arrowheads: TUNEL-positive cells. Autofl.: tissue autofluorescence used for image contrast and anatomical reference. CEP: corneal epithelium; CST: corneal stroma; CEN: corneal endothelium; GCL: ganglion cell layer; IPL: inner plexiform layer; INL: inner nuclear layer; OA: ocular alterations; OPL: outer plexiform layer; ONL; outer nuclear layer; PHL: photoreceptor layer; Tg/+: transgenic; +/+: wild type. The images are representative of the results observed in two fishes of each genotype.
Figure Data
Acknowledgments
This image is the copyrighted work of the attributed author or publisher, and
ZFIN has permission only to display this image to its users.
Additional permissions should be obtained from the applicable author or publisher of the image.
Full text @ Int. J. Mol. Sci.