
- Title
-
Revealing the Increased Stress Response Behavior through Transcriptomic Analysis of Adult Zebrafish Brain after Chronic Low to Moderate Dose Rates of Ionizing Radiation
- Authors
- Cantabella, E., Camilleri, V., Cavalie, I., Dubourg, N., Gagnaire, B., Charlier, T.D., Adam-Guillermin, C., Cousin, X., Armant, O.
- Source
- Full text @ Cancers
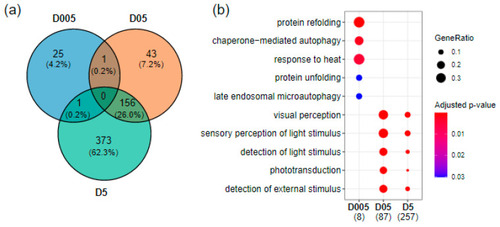
Transcriptomics effects of radiation exposure on zebrafish telencephalon. (a) Venn diagram of differentially expressed genes at the three dose rates (|fold change| ≥ 1.5 and adjusted p-value < 0.05. (b) GO enrichment of biological processes using human orthologues showing the top enriched pathways at D005 (0.05 mGy/h), D05 (0.5 mGy/h) and D5 (5 mGy/h). The numbers in brackets correspond to the number of genes present in the enriched GO terms. The dot size corresponds to the fraction of genes in a given GO term compared to all DEG (GeneRatio). |
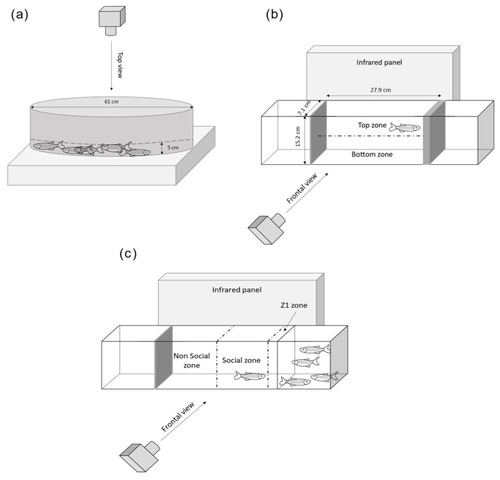
Experimental setup of the three behavioral tests. (a) The shoaling test, (b) the novel tank test, (c) the social preference test [57,58,59]. |
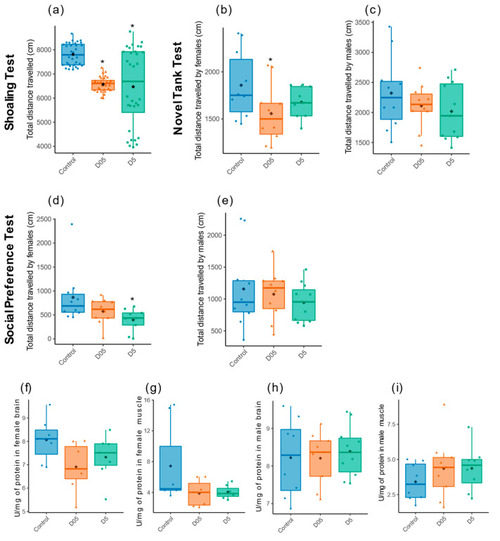
Effect of radiation exposure on locomotor activity and dosage of Acetylcholinesterase activity. Total distance travelled in centimeter (cm) was evaluated by (a) Shoaling test (n = 32), (b,c) Novel tank test and (d,e) Social preference test in females zebrafish (n = 9–10) and males (n = 10–11). Data are represented by mean (black point), median (horizontal line) and ±75th and 25th percentiles, and significance assessed by Gamma generalized linear mixed models (a) or Gaussian linear effects models (b–e). Measure of AChE activity in (f) brain and (g) muscle of females, and in males (h,i). Data are represented by mean (black point), median (horizontal line) and ±75th and 25th percentiles of 7 individuals per condition. AChE activity is shown as enzymatic activity Unit per mg of protein (U/mg protein). Statistical analysis was performed by using one-way ANOVA followed by Dunnet post-hoc test. * p < 0.05. |
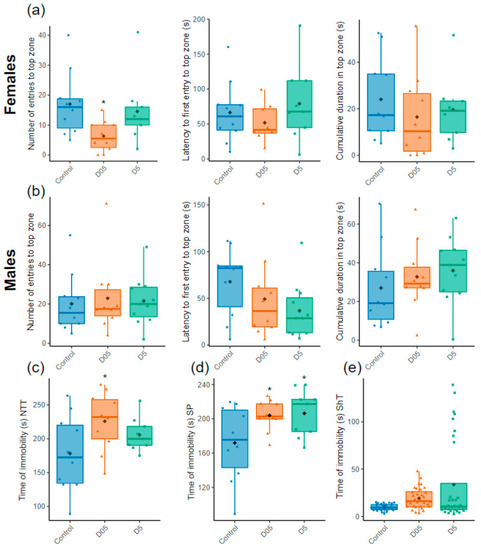
Assessment of stress behavior. (a) Number of entries, latency to first entry and time spent in the top zone in the novel tank test (NTT) for females and (b) males (n = 9–11). (c) Time of immobility of females in the NTT (n = 9–10), (d) the Social Preference test (SP) (n = 9–10 females or males) and (e) the Shoaling test (ShT) (n = 32 both females and males). Data are represented by mean (black point), median (horizontal line), ±75th and 25th percentiles and analyzed with negative binomial mixed effect models (a,b, left panels) or Gaussian linear effects models (a,b, middle and right panel, c,d) or Gamma generalized linear mixed models (e). * p < 0.05. |
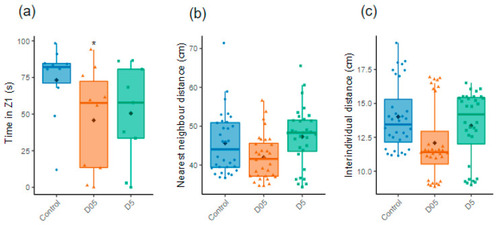
Assessment of individual and group social behavior. (a) Time in Z1 evaluated for females during the Social Preference test (n = 9–10). (b) Nearest neighbor distances and (c) Inter-individual distances analyzed during the Shoaling test (ShT) (n = 32). Data are represented by mean (black point), median (horizontal line), ±75th and 25th percentiles and analyzed with Gaussian linear effect model (a), Gamma generalized linear mixed models (b,c). * p < 0.05. |
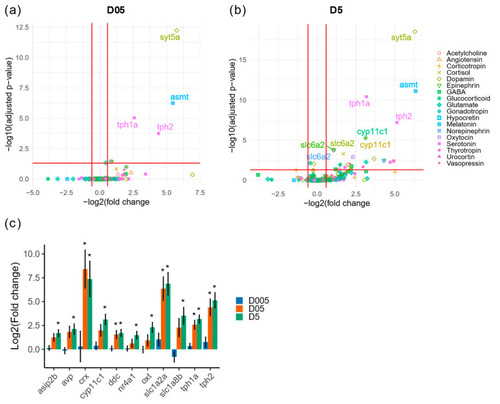
Transcriptomic analysis of genes with function in neurotransmission or neurohormones. (a) Volcano plot of differentially expressed genes with function in neurotransmission or brain neurohormones at D05 (0.5 mGy/h) and (b) at D5 (5 mGy/h). The biological process associated to each gene is indicated by the color and shape code. (c) Change in expression of dysregulated genes. * Indicate adjusted p-value (<0.05). |
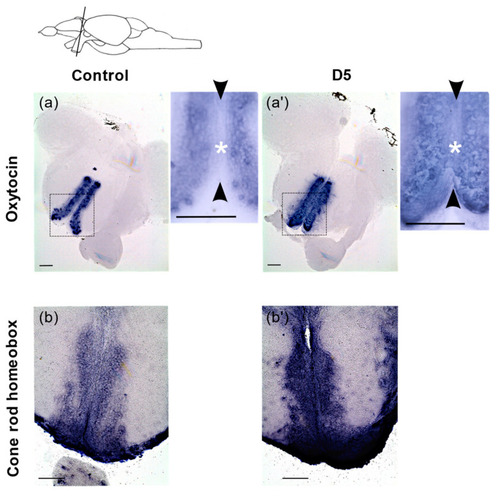
RNA in situ hybridization on adult brain sections showing expression of oxt and crx expressing cells. (a,a′) Coronal sections of brain showing expression of oxt in the anterior parvocellular preoptic nucleus (PPa) in control and 5mGy/(D5) irradiated fish. The black rectangle represents the area for the higher magnification images. (b,b′) Expression of crx in the PPa in the control and after irradiation at 5 mGy/h(D5). The black arrow heads delineate the ventricular zone (VZ) in the medial ventricular zone of the PPa and the white asterisk represents the location of VZ progenitors where ectopic expression is detected. Scale bar = 100 µm. The scheme at the top represents the location of the coronal sections in the brain. |