
|
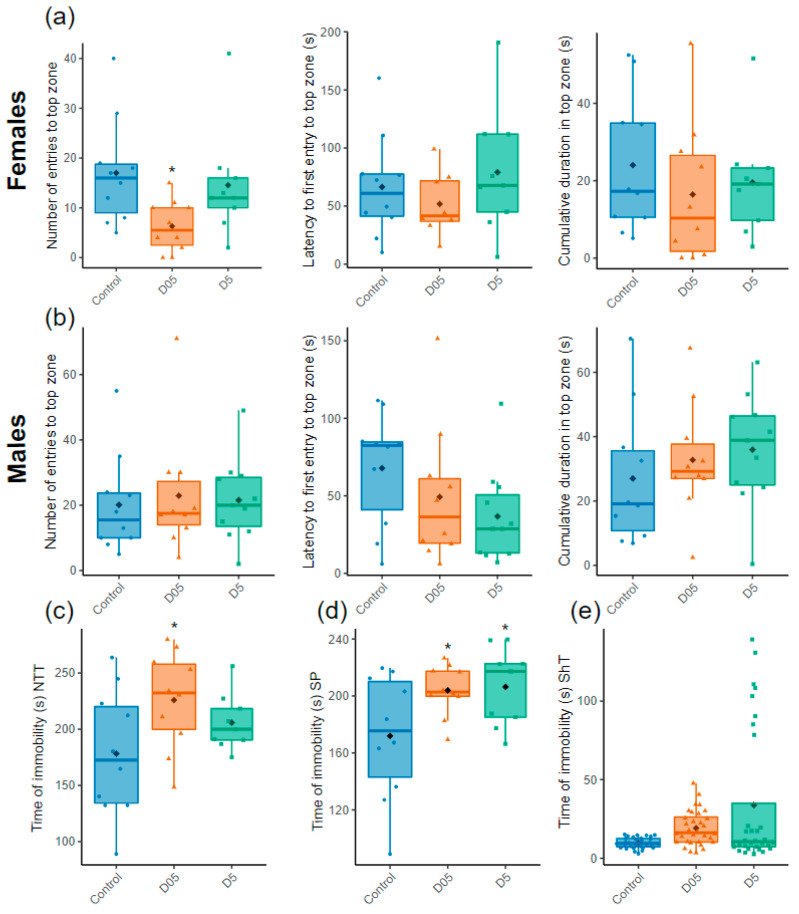
Fig. 4
Assessment of stress behavior. (a) Number of entries, latency to first entry and time spent in the top zone in the novel tank test (NTT) for females and (b) males (n = 9–11). (c) Time of immobility of females in the NTT (n = 9–10), (d) the Social Preference test (SP) (n = 9–10 females or males) and (e) the Shoaling test (ShT) (n = 32 both females and males). Data are represented by mean (black point), median (horizontal line), ±75th and 25th percentiles and analyzed with negative binomial mixed effect models (a,b, left panels) or Gaussian linear effects models (a,b, middle and right panel, c,d) or Gamma generalized linear mixed models (e). * p < 0.05.