
Image
|
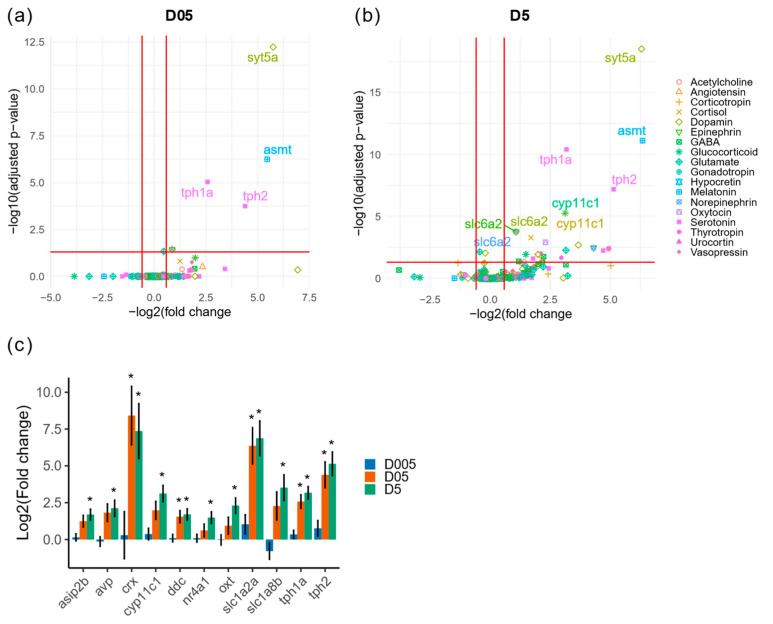
Figure Caption
Fig. 6
Transcriptomic analysis of genes with function in neurotransmission or neurohormones. (a) Volcano plot of differentially expressed genes with function in neurotransmission or brain neurohormones at D05 (0.5 mGy/h) and (b) at D5 (5 mGy/h). The biological process associated to each gene is indicated by the color and shape code. (c) Change in expression of dysregulated genes. * Indicate adjusted p-value (<0.05).
Acknowledgments
This image is the copyrighted work of the attributed author or publisher, and
ZFIN has permission only to display this image to its users.
Additional permissions should be obtained from the applicable author or publisher of the image.
Full text @ Cancers