
FIGURE
Fig. 6
- ID
- ZDB-FIG-220815-43
- Publication
- Cantabella et al., 2022 - Revealing the Increased Stress Response Behavior through Transcriptomic Analysis of Adult Zebrafish Brain after Chronic Low to Moderate Dose Rates of Ionizing Radiation
- Other Figures
- All Figure Page
- Back to All Figure Page
Fig. 6
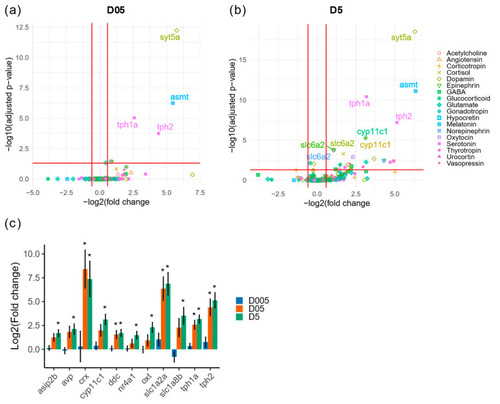
Transcriptomic analysis of genes with function in neurotransmission or neurohormones. (a) Volcano plot of differentially expressed genes with function in neurotransmission or brain neurohormones at D05 (0.5 mGy/h) and (b) at D5 (5 mGy/h). The biological process associated to each gene is indicated by the color and shape code. (c) Change in expression of dysregulated genes. * Indicate adjusted p-value (<0.05). |
Expression Data
Expression Detail
Antibody Labeling
Phenotype Data
Phenotype Detail
Acknowledgments
This image is the copyrighted work of the attributed author or publisher, and
ZFIN has permission only to display this image to its users.
Additional permissions should be obtained from the applicable author or publisher of the image.
Full text @ Cancers