
FIGURE
Fig. 5
- ID
- ZDB-FIG-220815-42
- Publication
- Cantabella et al., 2022 - Revealing the Increased Stress Response Behavior through Transcriptomic Analysis of Adult Zebrafish Brain after Chronic Low to Moderate Dose Rates of Ionizing Radiation
- Other Figures
- All Figure Page
- Back to All Figure Page
Fig. 5
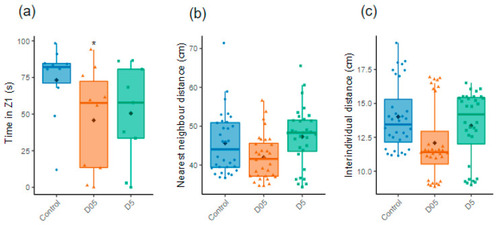
Assessment of individual and group social behavior. (a) Time in Z1 evaluated for females during the Social Preference test (n = 9–10). (b) Nearest neighbor distances and (c) Inter-individual distances analyzed during the Shoaling test (ShT) (n = 32). Data are represented by mean (black point), median (horizontal line), ±75th and 25th percentiles and analyzed with Gaussian linear effect model (a), Gamma generalized linear mixed models (b,c). * p < 0.05. |
Expression Data
Expression Detail
Antibody Labeling
Phenotype Data
Phenotype Detail
Acknowledgments
This image is the copyrighted work of the attributed author or publisher, and
ZFIN has permission only to display this image to its users.
Additional permissions should be obtained from the applicable author or publisher of the image.
Full text @ Cancers