
Image
|
Figure Caption
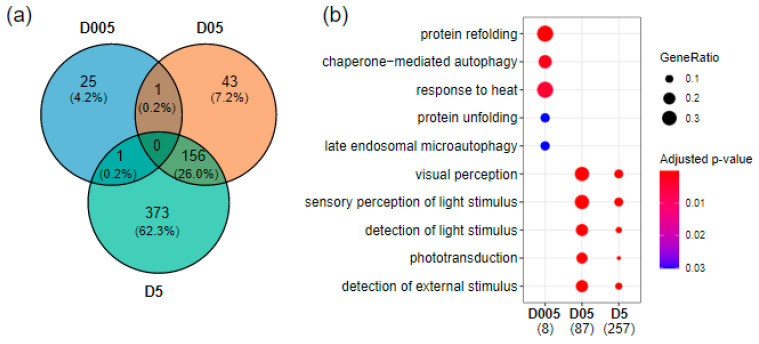
Fig. 1
Transcriptomics effects of radiation exposure on zebrafish telencephalon. (a) Venn diagram of differentially expressed genes at the three dose rates (|fold change| ≥ 1.5 and adjusted p-value < 0.05. (b) GO enrichment of biological processes using human orthologues showing the top enriched pathways at D005 (0.05 mGy/h), D05 (0.5 mGy/h) and D5 (5 mGy/h). The numbers in brackets correspond to the number of genes present in the enriched GO terms. The dot size corresponds to the fraction of genes in a given GO term compared to all DEG (GeneRatio).
Acknowledgments
This image is the copyrighted work of the attributed author or publisher, and
ZFIN has permission only to display this image to its users.
Additional permissions should be obtained from the applicable author or publisher of the image.
Full text @ Cancers