
- Title
-
Zebrafish fin regeneration involves generic and regeneration-specific osteoblast injury responses
- Authors
- Sehring, I.M., Mohammadi, H.F., Haffner-Luntzer, M., Ignatius, A., Huber-Lang, M., Weidinger, G.
- Source
- Full text @ Elife
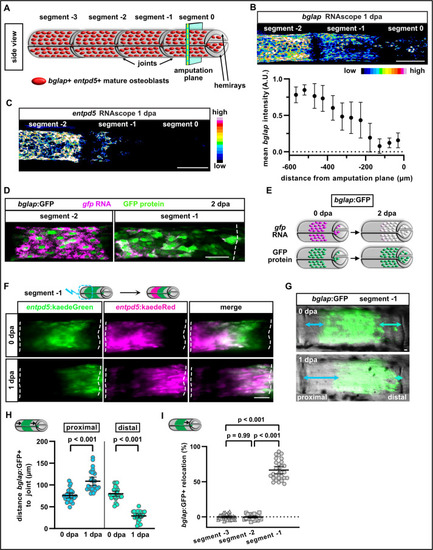
Osteoblasts dedifferentiate and migrate in response to fin amputation. (A) Schematic presentation of one fin ray with mature osteoblasts expressing bglap and entpd5 lining the hemirays. (B) RNAscope in situ analysis of bglap expression in segments 0, –1, and –2 at 1 day post amputation (dpa). Expression of bglap gradually decreases towards the amputation plane. N (experiments)=1, n (fins)=5, n (rays)=15. Error bars represent SEM. Scale bar, 100 µm. (C) RNAscope in situ detection of entpd5 expression in segments 0, –1, and –2 at 1 dpa. Scale bar, 100 µm. (D) In bglap:GFP fish, expression of gfp RNA is downregulated in segment –1 at 2 dpa, while GFP protein persists. Segment –2 shows overlap of gfp RNA and GFP protein (note that GFP protein is enriched in the nuclei). Dashed lines indicate segment border. Distal to the right. Scale bar, 50 µm (E) Scheme illustrating the use of bglap:GFP transgenics for analysis of osteoblast migration via relocation of cells that are negative for gfp RNA, but positive for GFP protein. (F) At 0 dpa, entpd5:Kaede positive osteoblasts in the proximal half of segment –1 were photoconverted from entpd5:kaedeGreen to entpd5:kaedeRed. Repeated imaging reveals distal relocation of photoconverted osteoblasts by 1 dpa. Dashed lines indicate segment borders. Distal to the right. Scale bar, 50 µm. (G) bglap:GFP is expressed in a subset of osteoblasts in the centre of each segment and absent around the joints. Repeated imaging reveals relocation of GFP+ cells towards the distal joint in segment –1 by 1 dpa. Distal to the right. Scale bar, 10 µm. (H) Quantification of the distance between the bulk of bglap:GFP+ cells and joints in segment –1 at 0 and 1 dpa. At 1 dpa, the proximal distance is increased, while the distal distance is reduced. N (experiments)=3, n (fins)=26, n (rays)=26. Error bars represent 95% CI. Unpaired t-test. (I) Quantification of bglap:GFP+ bulk migration in segment −3, –2, and –1 at 1 dpa. 100% indicates full crossing of the distance to the respective joint. Osteoblasts migrate distally in segment –1. N (experiments)=2, n (fins)=19, n (rays)=29. Error bars represent 95% CI. Mann Whitney test.
|
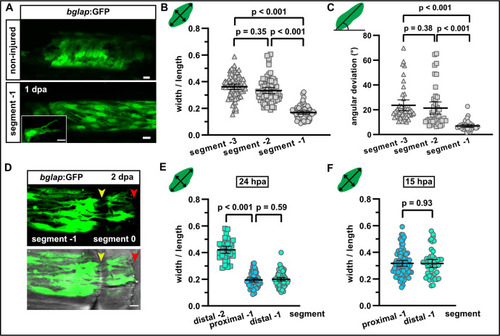
Osteoblasts elongate and orient along the proximodistal axis of the fin in response to fin amputation. (A) bglap:GFP+ osteoblast morphology in a non-injured fin (upper panel) and in segment –1 at 1 day post amputation (dpa) (lower panel). Scale bar, 10 µm. (B) Quantification of bglap:GFP+ osteoblast roundness as width/length ratio at 1 dpa. Osteoblasts are more elongated in segment –1. N (experiments)=1, n (fins)=5, n (rays)=5, n (cells)=72. Error bars represent 95% CI. Kruskal-Wallis test. (C) Quantification of bglap:GFP+ osteoblast orientation as angular deviation from the proximodistal axis at 1 dpa. In segment –1, osteoblasts display increased alignment along the axis. N (experiments)=1, n (fins)=5, n (rays)=5, n (cells)=44. Error bars represent 95% CI. Kruskal-Wallis test. (D) At 2 dpa, bglap:GFP+ osteoblasts can be observed within the distal joint of segment –1, and GFP+ protrusions can be seen spanning the joint, indicating that osteoblasts migrate through the joint. Yellow arrowheads, joints; red arrowheads, amputation plane. Scale bar, 10 µm. (E) Osteoblast roundness in distal and proximal parts of segments (40% of total segment length from the respective end) at 24 hpa. No difference within segment –1 can be detected. N (experiments)=1, n (fins)=5, n (rays)=5, n (cells)=34 (segment –2), 55 (proximal segment –1), 78 (distal segment –1). Error bars represent 95% CI. Mann-Whitney test. (F) Osteoblast roundness in distal and proximal parts of segment –1 at 15 hpa. No difference within segment –1 can be detected. N (experiments)=1, n (fins)=6, n (rays)=15, n (cells)=82 (proximal), 49 (distal). Error bars represent 95% CI. Mann-Whitney test. The observed relative difference is 0.3%, the calculated smallest significant difference 13%, which is smaller than what we observe between segment –2 and segment –1 (B, 54%).
PHENOTYPE:
|
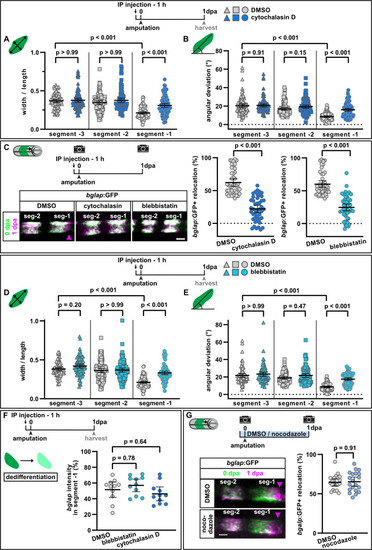
Interference with actomyosin, but not microtubule dynamics inhibits osteoblast cell shape changes and migration. (A) Osteoblast roundness at 1 day post amputation (dpa). Inhibition of actin dynamics with cytochalasin D does not alter osteoblast cell shape in segments –3 and –2, but cell elongation in segment –1 is inhibited. N (experiments)=3, n (fins)=15, n (rays)=15, n (cells)=87. Error bars represent 95% CI. Kruskal-Wallis test. (B) Osteoblast orientation at 1 dpa. Cytochalasin D does not alter osteoblast orientation in segments –3 and –2, but alignment along the proximodistal axis in segment –1 is impaired. N (experiments)=3, n (fins)=15, n (rays)=15, n (cells)=93. Error bars represent 95% CI. Kruskal-Wallis test. (C) Both cytochalasin D and blebbistatin treatment impair bulk osteoblast migration. Images show overlay of 0 dpa (green) and 1 dpa (pink) pictures, with the pink arrowhead indicating relocation of osteoblasts in controls, where no signal overlap is observed at the distal side. Graph: 100% indicates full crossing of the distance to the respective joint at 1 dpa. Cytochalasin D: N(experiments)=3, n (fins)=22, n (rays)=44; blebbistatin: n (fins)=24, n (rays)=48, appertaining controls have the same n. Error bars represent 95% CI. Mann-Whitney test. Scale bar, 100 µm. (D) Osteoblast roundness at 1 dpa. Inhibition of myosin activity with blebbistatin does not alter osteoblast cell shape in segments –3 and –2, but cell elongation in segment –1 is inhibited. N (experiments)=3, n (fins)=15, n (rays)=15, n (cells)=89. Error bars represent 95% CI. Kruskal-Wallis test. (E) Osteoblast orientation at 1 dpa. Blebbistatin does not alter osteoblast orientation in segments –3 and –2, but alignment along the proximodistal axis in segment –1 is impaired. N (experiments)=3, n (fins)=15, n (rays)=15, n (cells)=77. Error bars represent 95% CI. Kruskal-Wallis test. (F) Neither cytochalasin nor blebbistatin treatment affects osteoblast dedifferentiation. Plotted are the 1 dpa bglap RNAscope signal intensity levels in segment –1 relative to those in the same ray in segment –2. N (experiments)=1, n (fins)=6, n (rays)=12. Error bars represent 95% CI. Kruskal-Wallis test. The observed relative difference is 3% (blebbistatin) and 2% (cytochalasin), the calculated smallest significant difference for both assays is 9%, which is smaller than what we observe after retinoic acid treatment (" rid-ob="ob-fig4" co-legend-rid="lgnd_fig4">Figure 4B, 63%). (G) Inhibition of microtubule dynamics with nocodazole does not affect osteoblast migration. Images show overlay of 0 dpa (green) and 1 dpa (pink) pictures. N (experiments)=1, n (fins)=10, n (rays)=20. Error bars represent 95% CI. Unpaired t-test. The observed relative difference is 1%, the calculated smallest significant difference is 24% and thus smaller than what we observe in actomyosin treatment regimens (C, 60–63%). Scale bar, 100 µm.
PHENOTYPE:
|
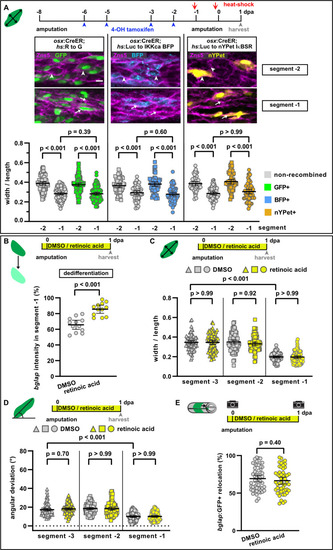
NF-κB and retinoic acid signalling regulate osteoblast dedifferentiation but not migration. (A) Mosaic recombination in osx:CreER; hs:R to G, osx:CreER; hs:Luc to IKKca BFP and osx:CreER; hs:Luc to nYPet IκBSR fish. Zns5 labels the membrane of osteoblasts. White arrowheads highlight roundish osteoblasts, white arrows elongated osteoblasts. Osteoblast roundness in recombined and non-recombined osteoblasts in segment –2 and segment –1 at 1 day post amputation (dpa) is plotted. Recombined osteoblasts expressing IKKca (marked by BFP) or IκBSR (marked by nYPet) elongate in segment –1 to a similar extent as osteoblasts expressing the negative control GFP. N (experiments)=1, R to G: n (fins)=3, n (rays)=10, n (cells)=406; IKKca: n (fins)=4, n (rays)=7, n (cells)=244; IκBSR: n (fins)=8, n (rays)=18, n (cells)=246. Error bars represent 95% CI. Kruskal-Wallis test. Scale bar, 10 µm. (B) Treatment with retinoic acid (RA) inhibits osteoblast dedifferentiation measured as bglap RNAscope intensity at 1 dpa in segment –1 relative to the intensity in segment –2 in the same rays. N (experiments)=1, n (fins)=6, n (rays)=12. Error bars represent 95% CI. Unpaired t-test. (C) Osteoblast roundness at 1 dpa. RA treatment does neither alter osteoblast cell shape in segments –3 and –2, nor elongation in segment –1. N (experiments)=2, n (fins)=10, n (rays)=10, n (cells)=83. Error bars represent 95% CI. Kruskal-Wallis test. The observed relative difference in segment –1 is 2%, the calculated smallest significant difference is 7%, which is smaller than what we observe in cytochalasin treatment regimens (Figure 3A, 22%). (D) Osteoblast orientation at 1 dpa. RA treatment does not affect osteoblast orientation in segments –3 and –2, nor alignment along the proximodistal axis in segment –1. N (experiments)=2, n (fins)=10, n (rays)=10, n (cells)=89. Error bars represent 95% CI. Kruskal-Wallis test. The observed relative difference in segment –1 is 1%, the calculated smallest significant difference is 7%, which is smaller than what we observe in cytochalasin treatment regimens (Figure 3B, 32%). (E) RA treatment does not affect bulk migration of osteoblasts towards the amputation plane in segment –1. N (experiments)=3, n (fins)=26, n (rays)=52. Error bars represent 95% CI. Unpaired t-test. The observed relative difference is 2%, the calculated smallest significant difference is 22%, which is smaller than what we observe in actomyosin treatment regimens (Figure 3C 60–63%).
PHENOTYPE:
|
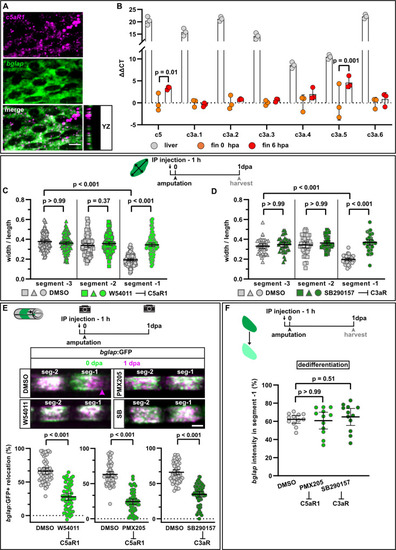
Complement system signalling regulates osteoblast cell shape changes and migration in vivo. (A) RNAscope in situ detection of c5aR1 expression in bglap expressing osteoblasts in a non-injured fin segment. YZ section shows localisation of both RNAs in the same cell layer. Scale bar, 10 µm. (B) Expression of complement factors detected by qRT-PCR in the liver, fins at 0 hpa and 6 hpa. Plotted are the ΔΔCT values relative to the 0 hpa fins. Each data point represents one biological replicate. Error bars represent SD. Two-way ANOVA. (C) Osteoblast roundness at 1 day post amputation (dpa). The C5aR1 inhibitor W54011 does not alter osteoblast cell shape in segments –3 and –2, but cell elongation in segment –1 is inhibited. N (experiments)=3, n (fins)=5, n (rays)=5, n (cells)=116. Error bars represent 95% CI. Kruskal-Wallis test. (D) Osteoblast roundness at 1 dpa. The C3R inhibitor SB290157 does not alter osteoblast cell shape in segments –3 and –2, but cell elongation in segment –1 is inhibited. N (experiments)=1, n (fins)=5, n (rays)=5, n (cells)=38. Error bars represent 95% CI. Kruskal-Wallis test. (E) Inhibition of C5aR1 with either W54011 or PMX205, and inhibition of C3aR with SB290157 impairs bulk osteoblast migration. Images show overlay of 0 dpa (green) and 1 dpa (pink) pictures. N (experiments)=3, W54011: n (fins)=27, n (rays)=54; PMX-205, SB290157: n (fins)=29, n (rays)=58. Error bars represent 95% CI. Mann-Whitney tests. Scale bar, 100 µm. (F) Neither inhibition of C5aR1 (W54011, PMX205) nor of C3aR (SB290157) affects osteoblast dedifferentiation measured as bglap RNAscope intensity at 1 dpa in segment –1 relative to the intensity in segment –2 of the same rays. N (experiments)=1; n (fins)=5 (DMSO), 4 (PMX205), 6 (SB290157); n (rays)=12. Error bars represent 95% CI. Kruskal-Wallis test. The observed relative difference is 1% for PMX205 and SB290157, the calculated smallest significant differences are 6% (PMX205) and 5% (SB290157), which are smaller than what we observe after retinoic acid treatment (Figure 4B; 7%).
|
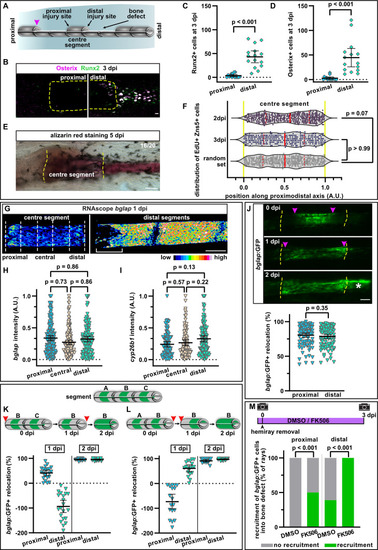
(A) Hemiray removal scheme creating a proximal and distal facing injury on both sides of a central intact segment. (B) At 3 days post injury (dpi), Runx2+ preosteoblasts and committed osteoblasts expressing Osterix have only accumulated in the bone defect beyond the distal injury site of the centre segment, but not beyond the proximal injury site, as determined by immunofluorescence. Dashed line outlines centre segment. Scale bar, 10 µm. (C, D) Quantification of the number of Runx2+ cells (C) or Osterix+ cells (D) located in the bone defect beyond the proximal and distal injury sites of the centre segment at 3 dpi. N (experiments)=2, n (rays)=15. Error bars represent 95% CI. Wilcoxon matched-pairs test. (E) At 5 dpi, mineralised bone as detected by alizarin red staining has formed beyond the distal, but not the proximal injury site of the centre segment. Dashed line indicates centre segment. n=16/20 rays with distal bone formation. Scale bar, 100 µm. (F) Distribution of all positions along the proximodistal axis of centre segments, where proliferating EdU+ Zns5+ osteoblasts were observed at 2 and 3 dpi. Yellow dashed lines indicate segment border. Solid red lines, median; dashed lines, quartiles. N (experiments)=1, 2 dpi: n (rays)=13, n (cells)=306; 3 dpi: n (rays)=17, n (cells)=305; random set: n (groups)=12, n (points)=360. Kolmogorov-Smirnov test. (G) RNAscope in situ detection of bglap expression in the centre segment and the two adjacent segments distal to the bone defect at 1 dpi. Dashed lines indicate the proximal, central, and distal regions of the centre segment used for quantification. Bracket indicates dedifferentiation zone in the distal segments. Scale bar, 100 µm. (H, I) Single cell analysis of RNAscope intensity of bglap (H) or cyp26b1 (I) relative to the brightest signal in proximal, central, and distal regions of the centre segment at 1 dpi. N (experiments)=2, n (segments)=8 (bglap), 7 (cyp26b1). Error bars represent 95% CI. Holm-Sidak’s multiple comparison test. (J) Migration of bglap:GFP+ osteoblasts towards both injury sites of the centre segment. Yellow dashed lines, segment borders. Pink arrowheads indicate relocation of GFP+ osteoblasts. Asterisk indicates GFP+ osteoblasts that have entered the distal bone defect. Distal to the right. N (experiments)=4, n (segments)=95. Error bars represent 95% CI. Wilcoxon matched-pairs test. Scale bar, 100 µm. (K, L) Sequential hemiray injuries reveal no preference for osteoblast migration in distal vs proximal directions. Relocation of bglap:GFP+ osteoblasts in the centre segment (segment B) is plotted. Error bars represent 95% CI. Red arrowheads indicate time points at which the adjacent hemirays (A=proximal, C=distal) were removed. Negative relocation indicates increased distance between GFP+ cells and the joint. (K) Removal of the proximal adjacent segment A at 0 dpi, followed by removal of the distal adjacent segment C at 1 dpi. (L) Removal of the distal adjacent segment C at 0 dpi, followed by removal of the proximal adjacent segment A at 1 dpi. (M) Migration of osteoblasts into the bone defect at 3 dpi. Treatment with FK506 induces recruitment of GFP+ cells beyond the proximal injury site and increases the number of centre segments that show recruitment of GFP+ cells beyond the distal injury site. N (experiments)=1, n (segments)=56 (DMSO), 17 (FK506). Fisher’s test. |
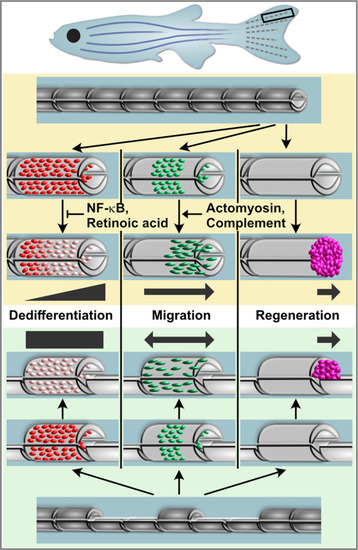
Osteoblast dedifferentiation and migration represent generic injury responses that are differentially regulated and can occur independently of each other and of regenerative bone growth. Upper panel: After fin amputation, osteoblasts downregulate the expression of differentiation markers. The extent depends on their distance to the amputation site, with osteoblasts close to the amputation site displaying more pronounced dedifferentiation. In addition, osteoblasts elongate and migrate towards the amputation plane and beyond to found osteogenic cells in the blastema (pink). Thus, osteoblast dedifferentiation, migration, and bone regeneration are all distally oriented. Osteoblast dedifferentiation is negatively regulated by NF-κB and retinoic acid signalling, while actomyosin dynamics and the complement system are required for directed osteoblast migration. Lower panel: In the hemiray removal model, a proximal and a distal injury are created on both sides of a remaining centre segment. The extent of osteoblast dedifferentiation is even along the centre segment, and osteoblasts migrate towards both injury sites. Yet, only at the distally-facing site, osteoblasts migrate into the bone defect, and blastema formation and bone regeneration only occur here. |