
|
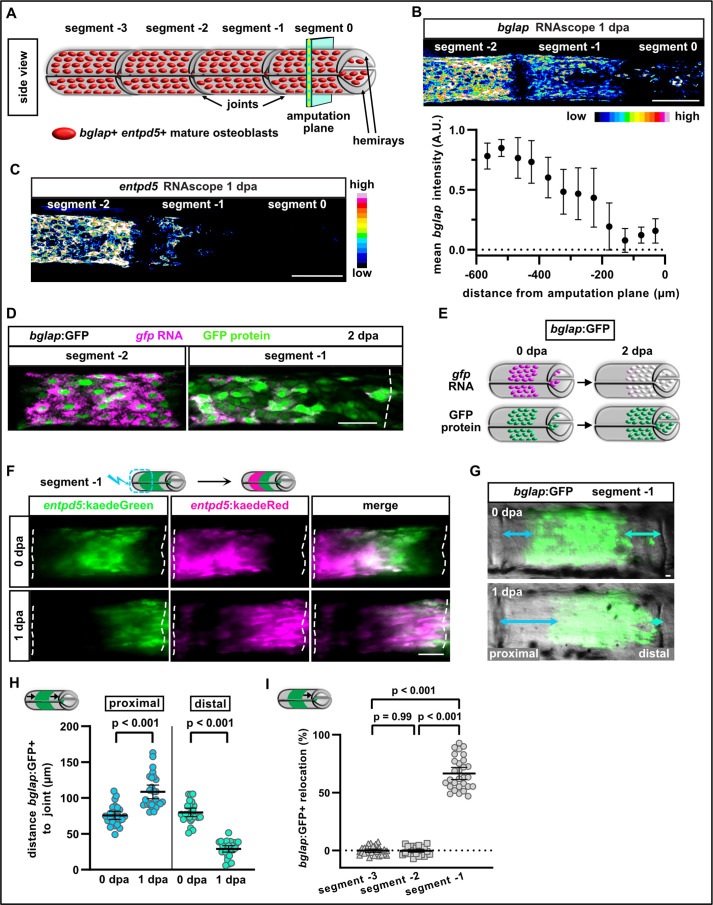
Fig. 1
(A) Schematic presentation of one fin ray with mature osteoblasts expressing bglap and entpd5 lining the hemirays. (B) RNAscope in situ analysis of bglap expression in segments 0, –1, and –2 at 1 day post amputation (dpa). Expression of bglap gradually decreases towards the amputation plane. N (experiments)=1, n (fins)=5, n (rays)=15. Error bars represent SEM. Scale bar, 100 µm. (C) RNAscope in situ detection of entpd5 expression in segments 0, –1, and –2 at 1 dpa. Scale bar, 100 µm. (D) In bglap:GFP fish, expression of gfp RNA is downregulated in segment –1 at 2 dpa, while GFP protein persists. Segment –2 shows overlap of gfp RNA and GFP protein (note that GFP protein is enriched in the nuclei). Dashed lines indicate segment border. Distal to the right. Scale bar, 50 µm (E) Scheme illustrating the use of bglap:GFP transgenics for analysis of osteoblast migration via relocation of cells that are negative for gfp RNA, but positive for GFP protein. (F) At 0 dpa, entpd5:Kaede positive osteoblasts in the proximal half of segment –1 were photoconverted from entpd5:kaedeGreen to entpd5:kaedeRed. Repeated imaging reveals distal relocation of photoconverted osteoblasts by 1 dpa. Dashed lines indicate segment borders. Distal to the right. Scale bar, 50 µm. (G) bglap:GFP is expressed in a subset of osteoblasts in the centre of each segment and absent around the joints. Repeated imaging reveals relocation of GFP+ cells towards the distal joint in segment –1 by 1 dpa. Distal to the right. Scale bar, 10 µm. (H) Quantification of the distance between the bulk of bglap:GFP+ cells and joints in segment –1 at 0 and 1 dpa. At 1 dpa, the proximal distance is increased, while the distal distance is reduced. N (experiments)=3, n (fins)=26, n (rays)=26. Error bars represent 95% CI. Unpaired t-test. (I) Quantification of bglap:GFP+ bulk migration in segment −3, –2, and –1 at 1 dpa. 100% indicates full crossing of the distance to the respective joint. Osteoblasts migrate distally in segment –1. N (experiments)=2, n (fins)=19, n (rays)=29. Error bars represent 95% CI. Mann Whitney test.