
|
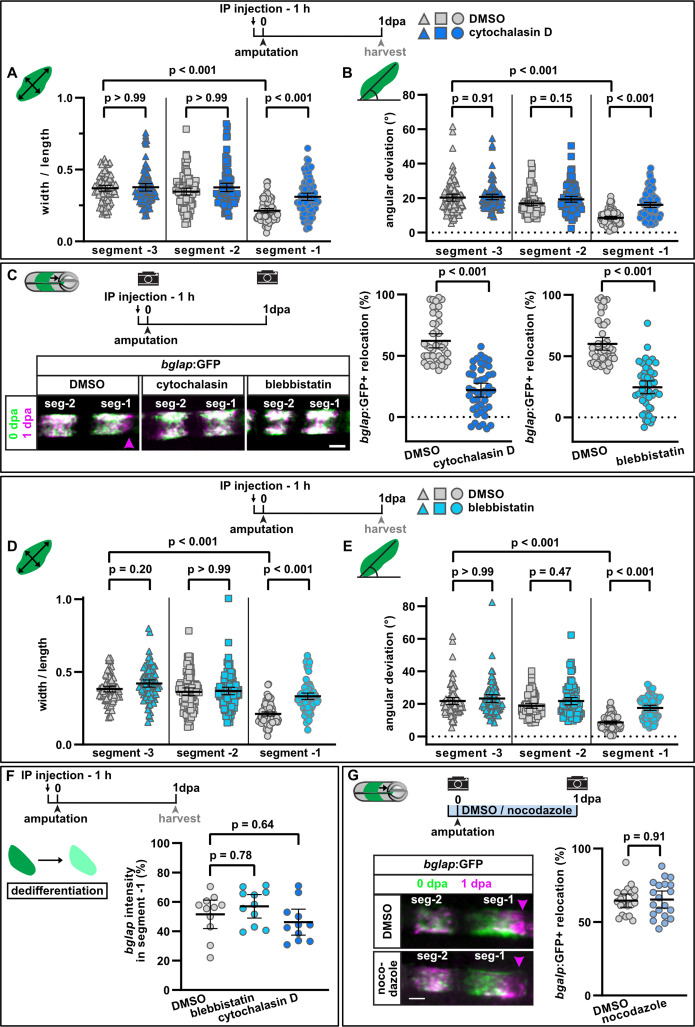
Fig. 3
(A) Osteoblast roundness at 1 day post amputation (dpa). Inhibition of actin dynamics with cytochalasin D does not alter osteoblast cell shape in segments –3 and –2, but cell elongation in segment –1 is inhibited. N (experiments)=3, n (fins)=15, n (rays)=15, n (cells)=87. Error bars represent 95% CI. Kruskal-Wallis test. (B) Osteoblast orientation at 1 dpa. Cytochalasin D does not alter osteoblast orientation in segments –3 and –2, but alignment along the proximodistal axis in segment –1 is impaired. N (experiments)=3, n (fins)=15, n (rays)=15, n (cells)=93. Error bars represent 95% CI. Kruskal-Wallis test. (C) Both cytochalasin D and blebbistatin treatment impair bulk osteoblast migration. Images show overlay of 0 dpa (green) and 1 dpa (pink) pictures, with the pink arrowhead indicating relocation of osteoblasts in controls, where no signal overlap is observed at the distal side. Graph: 100% indicates full crossing of the distance to the respective joint at 1 dpa. Cytochalasin D: N(experiments)=3, n (fins)=22, n (rays)=44; blebbistatin: n (fins)=24, n (rays)=48, appertaining controls have the same n. Error bars represent 95% CI. Mann-Whitney test. Scale bar, 100 µm. (D) Osteoblast roundness at 1 dpa. Inhibition of myosin activity with blebbistatin does not alter osteoblast cell shape in segments –3 and –2, but cell elongation in segment –1 is inhibited. N (experiments)=3, n (fins)=15, n (rays)=15, n (cells)=89. Error bars represent 95% CI. Kruskal-Wallis test. (E) Osteoblast orientation at 1 dpa. Blebbistatin does not alter osteoblast orientation in segments –3 and –2, but alignment along the proximodistal axis in segment –1 is impaired. N (experiments)=3, n (fins)=15, n (rays)=15, n (cells)=77. Error bars represent 95% CI. Kruskal-Wallis test. (F) Neither cytochalasin nor blebbistatin treatment affects osteoblast dedifferentiation. Plotted are the 1 dpa bglap RNAscope signal intensity levels in segment –1 relative to those in the same ray in segment –2. N (experiments)=1, n (fins)=6, n (rays)=12. Error bars represent 95% CI. Kruskal-Wallis test. The observed relative difference is 3% (blebbistatin) and 2% (cytochalasin), the calculated smallest significant difference for both assays is 9%, which is smaller than what we observe after retinoic acid treatment (" rid-ob="ob-fig4" co-legend-rid="lgnd_fig4">Figure 4B, 63%). (G) Inhibition of microtubule dynamics with nocodazole does not affect osteoblast migration. Images show overlay of 0 dpa (green) and 1 dpa (pink) pictures. N (experiments)=1, n (fins)=10, n (rays)=20. Error bars represent 95% CI. Unpaired t-test. The observed relative difference is 1%, the calculated smallest significant difference is 24% and thus smaller than what we observe in actomyosin treatment regimens (C, 60–63%). Scale bar, 100 µm.