
|
Fig. 4
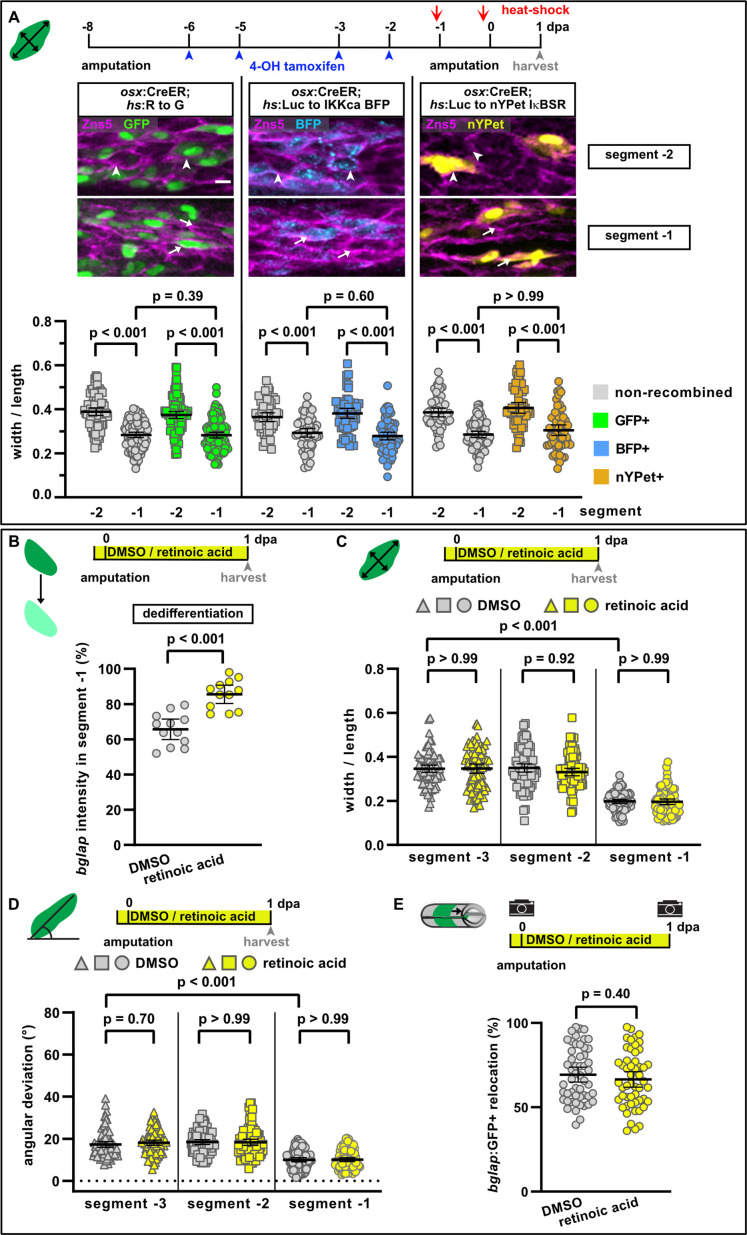
(A) Mosaic recombination in osx:CreER; hs:R to G, osx:CreER; hs:Luc to IKKca BFP and osx:CreER; hs:Luc to nYPet IκBSR fish. Zns5 labels the membrane of osteoblasts. White arrowheads highlight roundish osteoblasts, white arrows elongated osteoblasts. Osteoblast roundness in recombined and non-recombined osteoblasts in segment –2 and segment –1 at 1 day post amputation (dpa) is plotted. Recombined osteoblasts expressing IKKca (marked by BFP) or IκBSR (marked by nYPet) elongate in segment –1 to a similar extent as osteoblasts expressing the negative control GFP. N (experiments)=1, R to G: n (fins)=3, n (rays)=10, n (cells)=406; IKKca: n (fins)=4, n (rays)=7, n (cells)=244; IκBSR: n (fins)=8, n (rays)=18, n (cells)=246. Error bars represent 95% CI. Kruskal-Wallis test. Scale bar, 10 µm. (B) Treatment with retinoic acid (RA) inhibits osteoblast dedifferentiation measured as bglap RNAscope intensity at 1 dpa in segment –1 relative to the intensity in segment –2 in the same rays. N (experiments)=1, n (fins)=6, n (rays)=12. Error bars represent 95% CI. Unpaired t-test. (C) Osteoblast roundness at 1 dpa. RA treatment does neither alter osteoblast cell shape in segments –3 and –2, nor elongation in segment –1. N (experiments)=2, n (fins)=10, n (rays)=10, n (cells)=83. Error bars represent 95% CI. Kruskal-Wallis test. The observed relative difference in segment –1 is 2%, the calculated smallest significant difference is 7%, which is smaller than what we observe in cytochalasin treatment regimens (Figure 3A, 22%). (D) Osteoblast orientation at 1 dpa. RA treatment does not affect osteoblast orientation in segments –3 and –2, nor alignment along the proximodistal axis in segment –1. N (experiments)=2, n (fins)=10, n (rays)=10, n (cells)=89. Error bars represent 95% CI. Kruskal-Wallis test. The observed relative difference in segment –1 is 1%, the calculated smallest significant difference is 7%, which is smaller than what we observe in cytochalasin treatment regimens (Figure 3B, 32%). (E) RA treatment does not affect bulk migration of osteoblasts towards the amputation plane in segment –1. N (experiments)=3, n (fins)=26, n (rays)=52. Error bars represent 95% CI. Unpaired t-test. The observed relative difference is 2%, the calculated smallest significant difference is 22%, which is smaller than what we observe in actomyosin treatment regimens (Figure 3C 60–63%).