
Fig. 5
- ID
- ZDB-FIG-220715-60
- Publication
- Sehring et al., 2022 - Zebrafish fin regeneration involves generic and regeneration-specific osteoblast injury responses
- Other Figures
- All Figure Page
- Back to All Figure Page
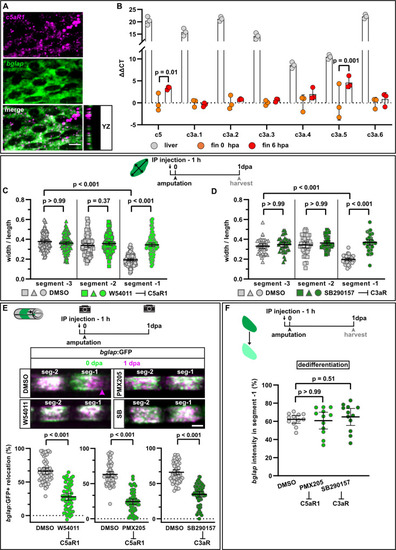
Complement system signalling regulates osteoblast cell shape changes and migration in vivo. (A) RNAscope in situ detection of c5aR1 expression in bglap expressing osteoblasts in a non-injured fin segment. YZ section shows localisation of both RNAs in the same cell layer. Scale bar, 10 µm. (B) Expression of complement factors detected by qRT-PCR in the liver, fins at 0 hpa and 6 hpa. Plotted are the ΔΔCT values relative to the 0 hpa fins. Each data point represents one biological replicate. Error bars represent SD. Two-way ANOVA. (C) Osteoblast roundness at 1 day post amputation (dpa). The C5aR1 inhibitor W54011 does not alter osteoblast cell shape in segments –3 and –2, but cell elongation in segment –1 is inhibited. N (experiments)=3, n (fins)=5, n (rays)=5, n (cells)=116. Error bars represent 95% CI. Kruskal-Wallis test. (D) Osteoblast roundness at 1 dpa. The C3R inhibitor SB290157 does not alter osteoblast cell shape in segments –3 and –2, but cell elongation in segment –1 is inhibited. N (experiments)=1, n (fins)=5, n (rays)=5, n (cells)=38. Error bars represent 95% CI. Kruskal-Wallis test. (E) Inhibition of C5aR1 with either W54011 or PMX205, and inhibition of C3aR with SB290157 impairs bulk osteoblast migration. Images show overlay of 0 dpa (green) and 1 dpa (pink) pictures. N (experiments)=3, W54011: n (fins)=27, n (rays)=54; PMX-205, SB290157: n (fins)=29, n (rays)=58. Error bars represent 95% CI. Mann-Whitney tests. Scale bar, 100 µm. (F) Neither inhibition of C5aR1 (W54011, PMX205) nor of C3aR (SB290157) affects osteoblast dedifferentiation measured as bglap RNAscope intensity at 1 dpa in segment –1 relative to the intensity in segment –2 of the same rays. N (experiments)=1; n (fins)=5 (DMSO), 4 (PMX205), 6 (SB290157); n (rays)=12. Error bars represent 95% CI. Kruskal-Wallis test. The observed relative difference is 1% for PMX205 and SB290157, the calculated smallest significant differences are 6% (PMX205) and 5% (SB290157), which are smaller than what we observe after retinoic acid treatment (Figure 4B; 7%).
|
| Genes: | |
|---|---|
| Fish: | |
| Condition: | |
| Anatomical Term: | |
| Stage: | Adult |
| Fish: | |
|---|---|
| Conditions: | |
| Observed In: | |
| Stage: | Adult |