
- Title
-
VPS28 regulates brain vasculature by controlling neuronal VEGF trafficking through extracellular vesicle secretion
- Authors
- Dong, X., Jiang, D., Wang, L., Zhao, J., Yu, L., Huang, Y., Wu, X., Zhu, Y., Zhao, Y., Zhao, Q., Zhang, G., Li, X.
- Source
- Full text @ iScience
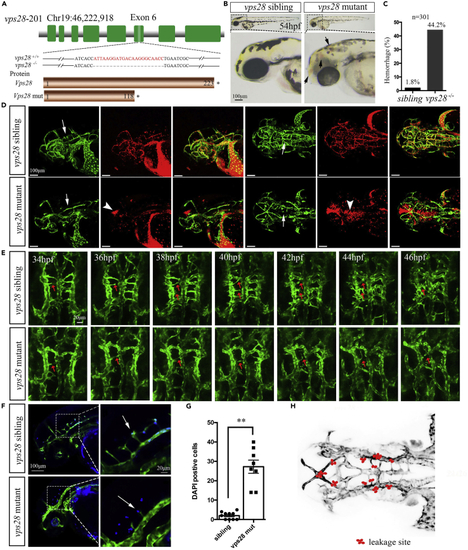
vps28 knockout displayed the abnormal angiogenesis of brain vascular CtAs in zebrafish larval (A) Schematic showed that the vps28 mutant generated by the CRISPR/Cas9 system was with 22 bp deletion in exon 6, and the predicted Vps28 mutant protein was shortened with only 118 amino acids. (B) The phenotype of vps28 mutant with intracranial hemorrhage (black arrows) in 54 hpf zebrafish larval. Scale bar: 100 μm. (C) Proportion of the intracranial hemorrhage occurred in vps28 mutants at 54 hpf. (D) Confocal images shown that vps28 loss-of-function caused defective of CtAs formation (arrows) and blood cell leakage (arrowheads) in the brain of Tg (Kdrl: eGFP; Gata1: DsRed) larvae at 54 hpf. Scale bar: 100 μm. (E) Confocal time-lapse shown that in vps28 mutant the CtAs sprouting (arrows) and the connection of CtAs with BA was failed in live Tg (Kdrl: eGFP) embryos between 34 hpf and 46 hpf. Scale bar: 20 μm. (F) Confocal images shown that vps28 depleted embryos caused more DAPI-positive particles (blue) in the brain of Tg (Kdrl: eGFP) embryos at 54 hpf, the area outline by the rectangles in the left are enlarged in the right. Scale bar: 100 μm (left) and 20 μm (right). (G) Leakage of DAPI out of vascular in vps28 mutants was counted. (H) Schematic shows the leakage site (red dots) in all 8 mutants as observed by confocal imaging. Green color represents the blood vessels (D, E, and F) and red color represents the red blood cell (D). Data are represented as mean +/− SD. ∗∗p < 0.01. |
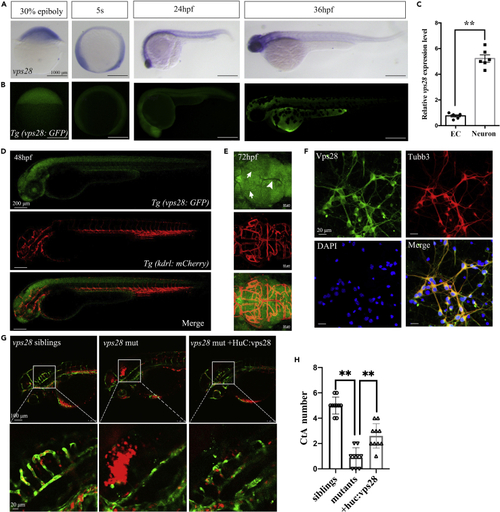
Vps28 was enriched in CNS and cultured mouse cortical neurons (A) The expression pattern of vps28 at 30% epiboly, 5-somite (5s), 24 hpf, and 36 hpf stage in zebrafish. (B) Relative expression pattern of vps28 in Tg (Vps28: GFP). (C) Relative expression level of vps28 in zebrafish ECs and neurons, which were sorted by flow cytometry from Tg (Kdrl: eGFP) and Tg (Huc: eGFP) embryos at 2 dpf, respectively. (D and E) Expression of vps28 in Tg (vps28: eGFP; Kdrl: mCherry) at 48 hpf and 72 hpf. vps28 was mainly expressed in the zebrafish CNS than DLV (arrowhead) and MsV (arrow) at 72 hpf; DLV, dorsal longitudinal vein; MsV, Mesencephalic vein (E). (F) Confocal images of primary mouse cortical neurons immunolabeled with Vps28 at 5 days in culture, a majority of the Tubb3 expressing neurons express detectable levels of Vps28 in primary mouse cortical neurons. (G) Effects of vps28 driven by the HuC promoter (huc: vps28) on CtAs defects of vps28 mutants. (H) Graphical representations of the CtAs numbers in (G). Data are represented as mean +/− SD. ∗∗p < 0.01. EXPRESSION / LABELING:
|
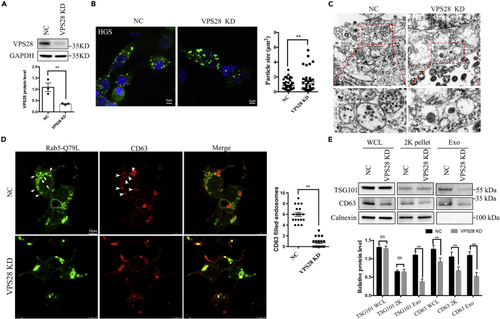
VPS28 regulates secretion of EVs in vitro (A) Western blot analysis of VPS28 knockdown efficiency by siRNA in 293T cell line. (B) Confocal images analysis of the endosome markers HGS in 293T cells co-transfected with VPS28 negative control siRNA or VPS28 siRNA. Right graph, quantification of HGS + average particle size per cell. Scale bar, 5 μm. (C) TEM analysis of representative fields with MVBs in 293T cells transfected with VPS28 negative control siRNA or VPS28 siRNA. The area outlined by the rectangles in the upper graph is enlarged in the lower graph. Scale bar, 0.5 μm. (D) Confocal images analysis of CD63 (red) and Rab5-Q79L-GFP + endosomes (green) in control and VPS28 knockdown 293T cells. Right graph, number of endosomes per cell. (E) Western blot analysis of EVs collected by ultracentrifugation from cell culture supernatants from control or VPS28 knockdown 293T cells. Cells, 2K centrifugation particles, and EVs (Exo) were blotted for the EVs markers TSG101, CD63, and for the endoplasmic reticulum marker Calnexin. Data are represented as mean +/− SD. ∗∗p < 0.01. |
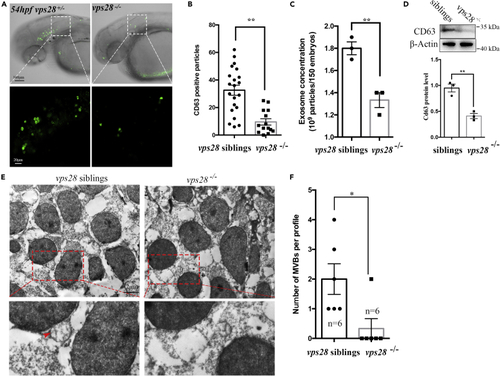
Vps28 controlling the secretion of EVs in zebrafish (A) Confocal images analysis of CD63 positive particles in zebrafish CNS at 54 hpf. Huc:CD63-eGFP plasmids were microinjected into the 1-cell stage zebrafish Vps28 mutants, the area outline by the rectangles upper graph are enlarged in lower graph. (B) CD63 positive particles were dramatically decreased in vps28 knockout embryos. (C) NTA analysis of total EVs concentration in 2.5dpf vps28 siblings and vps28 mutants. (D) Western analysis of EVs marker CD63 expression in 2.5dpf vps28 siblings and vps28 depletion embryos. (E) TEM analysis of representative fields with MVBs in vps28 siblings and vps28 depletion embryos at 54 hpf. The area outlined by the rectangles in the upper graph is enlarged in the lower graph. Scale bar, 2 μm. (F) Quantification of MVB numbers in the fields of vps28 siblings and vps28 mutants (n = 6). Data are represented as mean +/− SD. ∗p < 0.05, ∗∗p < 0.01. PHENOTYPE:
|
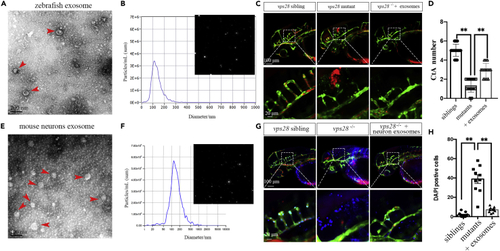
Zebrafish and primary mouse cortical neurons-derived EVs could partially rescue the angiogenesis of CtAs in vps28 mutants (A and B) Characterization of zebrafish-derived EVs by TEM and NTA in 54 hpf larvae. The arrowhead represents the classical EVs. (C) Zebrafish embryos-derived EVs microinjected into the CCV of zebrafish embryos could alleviate the CtAs defect in vps28 mutants at 54 hpf. (D) Graphical representations of the CtAs numbers in (C). (E and F) Characterization of primary mouse cortical neurons derived EVs by TEM. The arrowhead represents the EVs. (G and H) Primary mouse cortical neurons-derived EVs microinjected into the CCV of zebrafish embryos could rescue the development of CtAs (G) and reduce the neurovascular DAPI leakage (H) in 54 hpf larvae. Data are represented as mean +/− SD. ∗p < 0.05. |
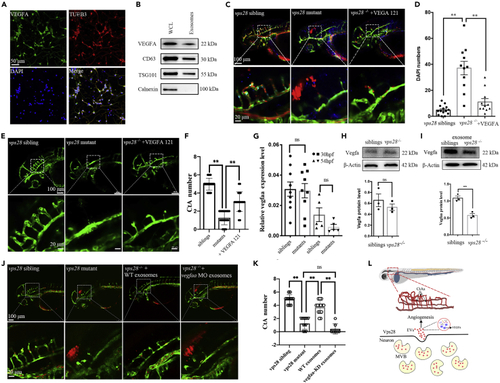
Neuronal EVs contained VEGFA are involved in brain vascular angiogenesis (A) Confocal images analysis of VEGF-A expression in mouse primary cortical neurons at 5 days in culture. (B) Western blot identification of the EVs derived VEGF-A in mouse primary cortical neurons. (C) Confocal images analysis of rescued-intracerebral-hemorrhage phenotype in VEGF-121 microinjected vps28 mutants in 54 hpf Tg (Kdrl: eGFP; Gata1: DsRed) larvae. (D) Statistical analysis of DAPI leakage in the VEGF-121 injected embryos corresponding to (C). (E) Confocal images analysis of CtAs branching in VEGF-121 injected embryos at 54 hpf. (F) Graphical representations of the CtAs numbers in (E). (G) qPCR analysis of the vegfaa expression level in vps28 mutants and siblings at 30 hpf and 54 hpf. (H) Western blot analysis of Vegfa protein level in vps28 depleted embryos compared with vps28 siblings in the whole embryos. (I) Western blot analysis of Vegfa protein level in EVs of the 54 hpf vps28 mutants compared with relative vps28 siblings. (J) Effects of vegfaa specific deleted exosomes on vps28 mutants CtAs angiogenesis at 54 hpf. (K) Graphical representations of the CtAs numbers in (J). Data are represented as mean +/− SD. ∗∗p < 0.01. (L) Vps28 working model. Vps28 is highly expressed in neurons and participates in neurovascular communication by controlling the secretion of neuronal EVs. |