
|
Fig. 4
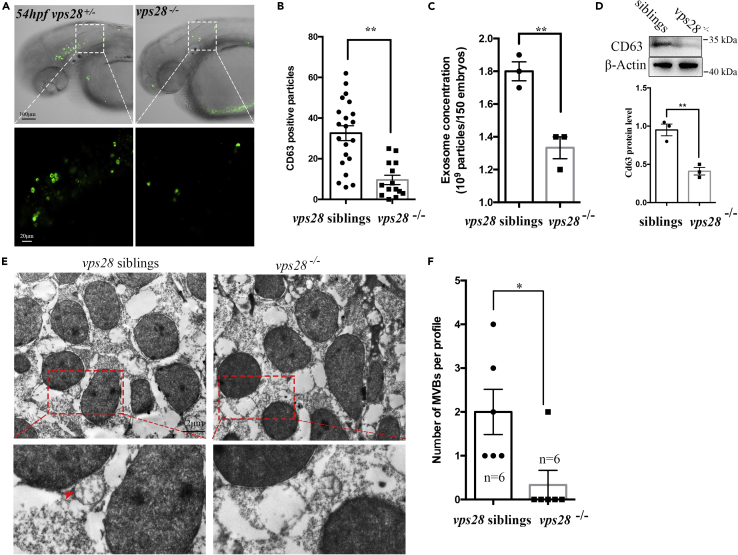
Vps28 controlling the secretion of EVs in zebrafish
(A) Confocal images analysis of CD63 positive particles in zebrafish CNS at 54 hpf. Huc:CD63-eGFP plasmids were microinjected into the 1-cell stage zebrafish Vps28 mutants, the area outline by the rectangles upper graph are enlarged in lower graph.
(B) CD63 positive particles were dramatically decreased in vps28 knockout embryos.
(C) NTA analysis of total EVs concentration in 2.5dpf vps28 siblings and vps28 mutants.
(D) Western analysis of EVs marker CD63 expression in 2.5dpf vps28 siblings and vps28 depletion embryos.
(E) TEM analysis of representative fields with MVBs in vps28 siblings and vps28 depletion embryos at 54 hpf. The area outlined by the rectangles in the upper graph is enlarged in the lower graph. Scale bar, 2 μm.
(F) Quantification of MVB numbers in the fields of vps28 siblings and vps28 mutants (n = 6). Data are represented as mean +/− SD. ∗p < 0.05, ∗∗p < 0.01.