
|
Fig. 3
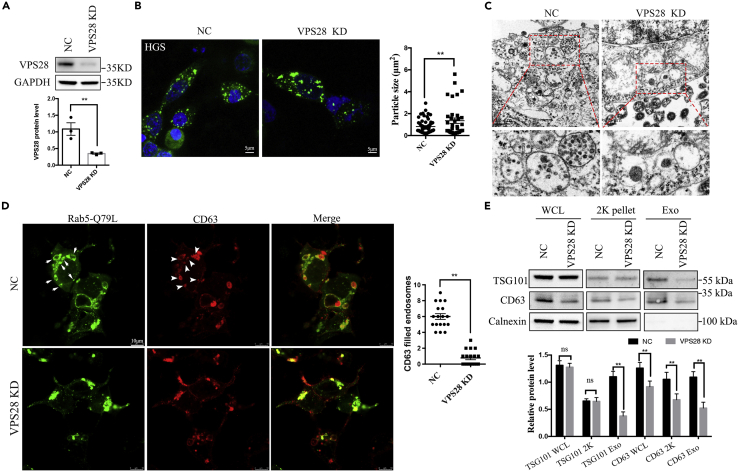
VPS28 regulates secretion of EVs in vitro
(A) Western blot analysis of VPS28 knockdown efficiency by siRNA in 293T cell line.
(B) Confocal images analysis of the endosome markers HGS in 293T cells co-transfected with VPS28 negative control siRNA or VPS28 siRNA. Right graph, quantification of HGS + average particle size per cell. Scale bar, 5 μm.
(C) TEM analysis of representative fields with MVBs in 293T cells transfected with VPS28 negative control siRNA or VPS28 siRNA. The area outlined by the rectangles in the upper graph is enlarged in the lower graph. Scale bar, 0.5 μm.
(D) Confocal images analysis of CD63 (red) and Rab5-Q79L-GFP + endosomes (green) in control and VPS28 knockdown 293T cells. Right graph, number of endosomes per cell.
(E) Western blot analysis of EVs collected by ultracentrifugation from cell culture supernatants from control or VPS28 knockdown 293T cells. Cells, 2K centrifugation particles, and EVs (Exo) were blotted for the EVs markers TSG101, CD63, and for the endoplasmic reticulum marker Calnexin. Data are represented as mean +/− SD. ∗∗p < 0.01.