
|
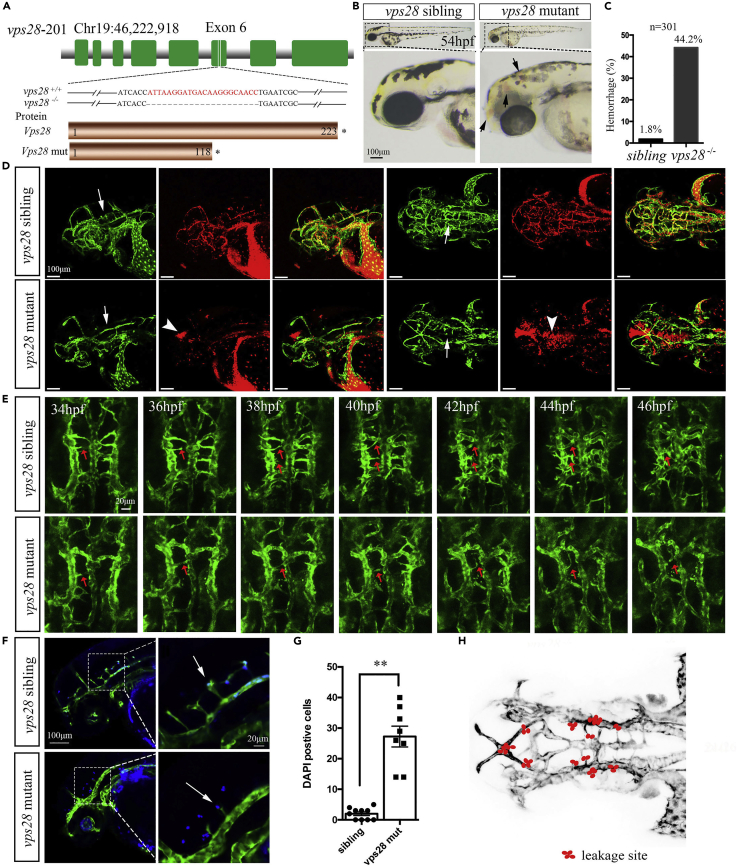
Fig. 1
vps28 knockout displayed the abnormal angiogenesis of brain vascular CtAs in zebrafish larval
(A) Schematic showed that the vps28 mutant generated by the CRISPR/Cas9 system was with 22 bp deletion in exon 6, and the predicted Vps28 mutant protein was shortened with only 118 amino acids.
(B) The phenotype of vps28 mutant with intracranial hemorrhage (black arrows) in 54 hpf zebrafish larval. Scale bar: 100 μm.
(C) Proportion of the intracranial hemorrhage occurred in vps28 mutants at 54 hpf.
(D) Confocal images shown that vps28 loss-of-function caused defective of CtAs formation (arrows) and blood cell leakage (arrowheads) in the brain of Tg (Kdrl: eGFP; Gata1: DsRed) larvae at 54 hpf. Scale bar: 100 μm.
(E) Confocal time-lapse shown that in vps28 mutant the CtAs sprouting (arrows) and the connection of CtAs with BA was failed in live Tg (Kdrl: eGFP) embryos between 34 hpf and 46 hpf. Scale bar: 20 μm.
(F) Confocal images shown that vps28 depleted embryos caused more DAPI-positive particles (blue) in the brain of Tg (Kdrl: eGFP) embryos at 54 hpf, the area outline by the rectangles in the left are enlarged in the right. Scale bar: 100 μm (left) and 20 μm (right).
(G) Leakage of DAPI out of vascular in vps28 mutants was counted.
(H) Schematic shows the leakage site (red dots) in all 8 mutants as observed by confocal imaging. Green color represents the blood vessels (D, E, and F) and red color represents the red blood cell (D). Data are represented as mean +/− SD. ∗∗p < 0.01.