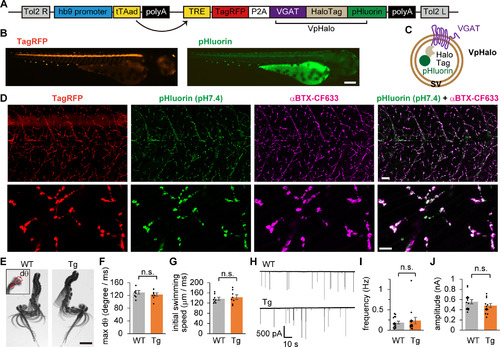
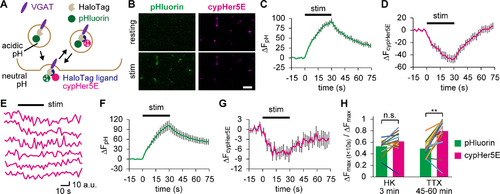
Tg zebrafish expressing two independent indicators of SV recycling in motoneurons. A, Diagram represents the transgene construct introduced in the Tg (hb9:tTAad, TRE:TagRFP-P2A-VpHalo) zebrafish. The hb9 promoter drives the expression of the tTAad, which in turn induces the expression of TagRFP and VpHalo through its interaction with the tetracycline response element (TRE) composite promoter. B, Fluorescent stereoscopic images of TagRFP and pHluorin in an anesthetized Tg zebrafish at 4 dpf. Scale bar, 200 μm. C, Diagram represents VpHalo that resides on the SV membrane. D, Confocal microscopic images of TagRFP, pHluorin (pH 7.4), and postsynaptic AChR clusters visualized by α-BTX-CF633 in PFA-fixed Tg zebrafish. Bottom panels, z-stack images with higher magnification. Scale bars: 20 μm, 10 μm. E, Swimming was elicited by puff stimulus onto the tail of a 4 dpf zebrafish, and the images were captured at 1000 frames/s. Superimposed images at 4 ms intervals are shown for representative larvae from WT or Tg. Inset, An image with two frames superimposed at 1 ms interval, from which dθ corresponding to the head-turn speed (degree/ms) was measured. Scale bar, 1 mm. F, G, Maximum head-turn speed (F) and swimming speed calculated from the distance traveled during initial 30 ms (G) in WT (n = 8 fish) or Tg (n = 8 fish) fish. There was no significant difference between the two groups in head-turn speed (p = 0.39, unpaired t test) or swimming speed (p = 0.58, unpaired t test). H, Representative traces of mEPCs recorded from the fast muscle of WT or Tg zebrafish. I, J, Frequency (I) and amplitude (J) of mEPCs recorded from WT (n = 15 cells from 8 fish) or Tg (n = 14 cells from 6 fish) fish. No significant difference was found between the two groups in terms of frequency (p = 0.60, unpaired t test) or amplitude (p = 0.20, unpaired t test).

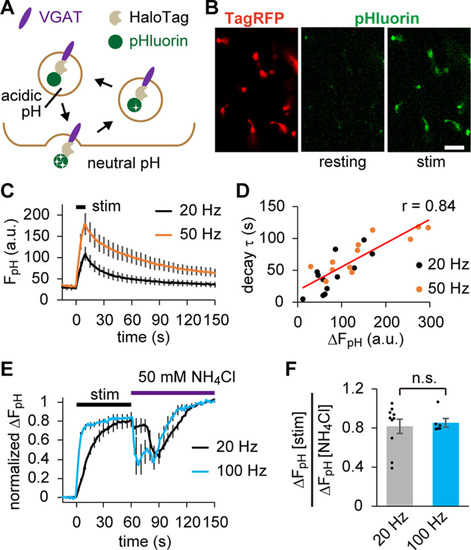
pHluorin live imaging indicated that SVs carrying VpHalo recycle normally in response to APs. A, Diagram represents changes in pHluorin fluorescence during recycling of SVs carrying VpHalo. B, Confocal live images of pHluorin before (resting) and after (stim) APs at 20 Hz for 10 s. The reporter TagRFP fluorescence in the same region is also shown. Scale bar, 10 μm. C, pHluorin fluorescence in response to APs at 20 Hz (n = 12 experiments from 7 fish) and 50 Hz (n = 12 experiments from 7 fish). D, Relationship between the AP-induced fluorescence increase (ΔFpH) and the decay time constant (decay τ). E, pHluorin fluorescence after Baf A1 treatment in response to APs at 20 Hz (n = 10 experiments from 10 fish) and 100 Hz (n = 6 experiments from 6 fish). To measure the maximal fluorescence, 50 mm NH4Cl was subsequently applied. F, ΔFpH [stim] normalized to the fluorescence achieved by NH4Cl application (ΔFpH [NH4Cl]). No significant difference was observed between the two groups (p = 0.72, unpaired t test). Error bars indicate ±SEM.

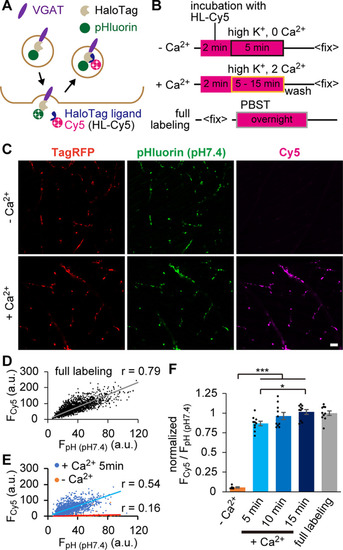
HaloTag-based SV labeling enabled quantifying the fraction of recycled SVs. A, Diagram represents HaloTag labeling with HL-Cy5 during recycling of SVs carrying the VpHalo. B, Diagram represents the timeline of the labeling experiment. Fish preparations were subjected to incubation with HL-Cy5 (magenta square) combined with HK depolarization in the absence (boxed in black; –Ca2+) or presence (boxed in orange; +Ca2+) of [Ca2+]o. In parallel, fish after fixation were incubated overnight in PBST containing HL-Cy5 (boxed in gray; full labeling). C, Confocal images of TagRFP, pHluorin (pH 7.4), and Cy5 at the NMJs of fish stimulated by HK for 5 min in the absence (–Ca2+) or presence (+Ca2+) of [Ca2+]o. Scale bar, 10 μm. D, E, Relationship between pHluorin fluorescence (FpH (pH7.4)) and Cy5 fluorescence (Fcy5) measured at individual ROI in full labeling (D) and HK-stimulated (E) conditions. F, Average Fcy5/FpH (pH7.4) normalized to that of the value in a full labeling condition (n = 10 fish). +Ca2+ stimulation for 5 min (n = 10 fish), 10 min (n = 10 fish), and 15 min (n = 10 fish) mobilized larger SV fractions than –Ca2+ stimulation (n = 6 fish). *Adjusted p < 0.05, ***adjusted p < 0.001, one-way ANOVA followed by Bonferroni–Holm test. Error bars indicate ±SEM.

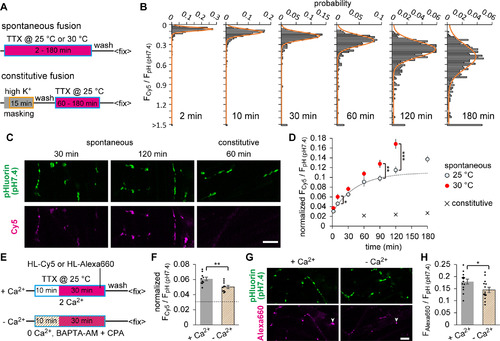
HaloTag labeling of spontaneously recycled SVs suggested two distinct populations of spontaneous fusion. A, Diagram represents the timeline of labeling experiments. Fish preparations were subjected to incubation with HL-Cy5 (magenta square) in the presence of 1 μm TTX for 2-180 min (boxed in blue) at 25°C or 30°C (spontaneous fusion). In measuring the constitutive fusion of transported organelles (constitutive fusion), labeling was performed after HaloTags were first masked by HK depolarization (boxed in orange) in the nonfluorescent ligand (gray square). B, Distribution of FCy5/FpH (pH7.4) measured at individual ROIs. Fish preparations were labeled with HL-Cy5 in the presence of TTX at 25°C for 2 min (483 ROIs), 10 min (538 ROIs), 30 min (547 ROIs), 60 min (556 ROIs), 120 min (526 ROIs), or 180 min (537 ROIs). All histograms were fitted with Gaussian distribution (orange line). C, Confocal images of pHluorin (pH 7.4) and Cy5 at the NMJs. Labeling was achieved by spontaneous fusion for 30 or 120 min, or constitutive fusion for 60 min. Scale bar, 10 μm. D, Time-dependent accumulation of labeled fraction, indicated as Fcy5/FpH (pH7.4) normalized to the value obtained by full labeling. Spontaneous fusions were labeled at 25°C for 2, 10, 30, 60, 90, 120, and 180 min (n = 12, 13, 12, 12, 12, 12, and 8 fish, respectively), or at 30°C for 2, 10, 30, 60, 90, and 120 min (n = 9, 12, 12, 12, 11, and 8 fish, respectively). A single exponential fitting to the averaged data up to 90 min at 25°C is shown. Constitutive fusions were labeled at 25°C for 60, 120, and 180 min (n = 10 fish). Temperature rise resulted in a significant increase in the spontaneous labeling at 10, 90, and 120 min (*p < 0.05, **p < 0.01, ***p < 0.001, unpaired t test). E, Diagram represents the timeline of labeling experiments with or without Ca2+. Fish preparations were preincubated with 1 μm TTX (boxed in blue) in 2 mm Ca2+ solution (+Ca2+) or Ca2+ free solution containing 50 μm BAPTA-AM and 50 μm cyclopiazonic acid (–Ca2+) for 10 min, and then labeled with HL-Cy5 or HL-Alexa-660 (magenta square) for 30 min at 25°C. F, Spontaneously labeled fraction with HL-Cy5 during 30 min incubation in +Ca2+ (n = 10 fish) or –Ca2+ (n = 10 fish) condition. Dashed line indicates the value obtained by 2 min labeling at 25°C shown in D, which reflects background signal, including the surface fraction. The labeled fraction was significantly decreased with the removal of free Ca2+ (**p < 0.01, unpaired t test). G, Confocal images of pHluorin (pH 7.4) and HL-Alexa-660 at the NMJs. Scale bar, 10 μm. Nonspecific signals (arrowhead), presumably resulting from the dye aggregation, precluded normalization by the pooled data in H. H, Average FAlexa660/FpH (pH7.4) in +Ca2+ (n = 14 fish) or –Ca2+ (n = 14 fish) condition. Reduction by the Ca2+ removal was similar between HL-Cy5 and HL-Alexa-660 (*p < 0.05, unpaired t test). Error bars indicate ±SEM.

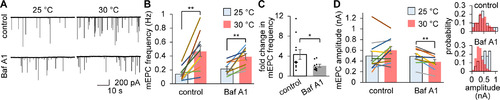
The temperature-dependent increase in mEPC events was greatly impaired by the inhibition of transmitter refilling. A, Traces of mEPC recorded at 25°C or 30°C from Baf A1-treated or Baf A1-untreated (control) muscles. B, Temperature dependency of mEPC frequency in control (n = 11 cells from 11 fish) and Baf A1-treated (n = 9 cells from 9 fish) conditions. In both conditions, temperature rise resulted in a significant increase in the mEPC frequency (**p < 0.01, paired t test). C, Fold change in mEPC frequency resulting from temperature rise. Baf A1 treatment significantly decreased the temperature dependency of mEPC frequency (*p < 0.05, unpaired t test). D, Temperature dependency of mEPC amplitude analyzed from the same datasets as in B. Temperature rise significantly reduced mEPC amplitude only in the Baf A1 condition (**p <0.01, paired t test). Right panels, Histograms of mEPC amplitudes recorded from representative cells. Error bars indicate ±SEM.

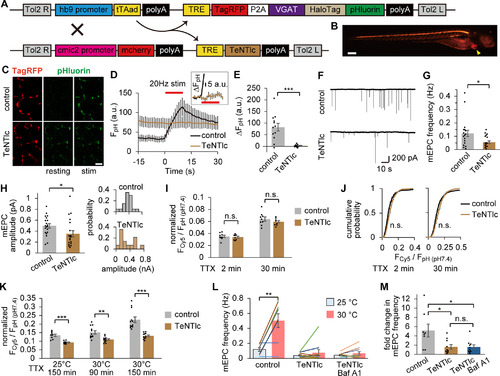
TeNT impaired the late-onset component of spontaneous SV labeling. A, Diagram represents transgene constructs for Tg (hb9:tTAad, TRE:TagRFP-P2A-VpHalo) and Tg (cmlc2:mcherry, TRE:TeNTlc) zebrafish. In the DTg fish, TeNTlc was expressed in addition to TagRFP and VpHalo in motoneurons via the Tet-Off system driven by the hb9 promoter. mcherry expressed in the heart by the cmlc2 promoter was used as a marker of the transgene. B, Fluorescent stereoscopic image of TagRFP and mcherry (arrowhead) in the DTg fish at 4 dpf. Scale bar, 200 μm. C, Confocal live images of pHluorin before (resting) and after (stim) APs at 20 Hz for 10 s in control or DTg fish. TagRFP fluorescence in the same region is also shown. Scale bar, 10 μm. D, pHluorin fluorescence in response to APs at the NMJs in control (n = 12 experiments from 6 fish) or DTg fish (n = 11 experiments from 6 fish). Inset, A magnified view of the fluorescence increase of DTg. E, Increases in fluorescence at the end of APs were significantly decreased in DTg fish (***p < 0.001, unpaired t test). F, Traces of mEPCs recorded from control or DTg fish. G, H, mEPC frequency (G) and amplitude (H) in control (n = 20 cells from 10 fish) or DTg fish (n = 20 cells from 10 fish). DTg fish showed significant reduction in both frequency (*p < 0.05, unpaired t test) and amplitude (*p < 0.05, unpaired t test). Right panels, Histograms of mEPC amplitudes recorded from representative cells. I, Spontaneously labeled fraction in control or DTg fish at 2 min (n = 9 or 8 fish, respectively) or 30 min (n = 9 or 9 fish, respectively) at 25°C. No significant difference was seen in 2 and 30 min labeling (p = 0.61 and 0.28, respectively, unpaired t test). J, Cumulative probability histogram of Fcy5/FpH (pH7.4) at individual ROIs from the data analyzed in H. No significant difference was seen both in 2 and 30 min labeling (p = 0.06 and 0.12, respectively, Kolmogorov–Smirnov test). K, Spontaneously labeled fraction in control or DTg fish over 150 min at 25°C (n = 9 or 9 fish, respectively), 90 min at 30°C (n = 12 or 12 fish, respectively), or 150 min at 30°C (n = 12 or 11 fish, respectively). The labeled fraction in DTg fish was significantly smaller than that of control in all conditions (**p < 0.01, ***p < 0.001, unpaired t test). L, Temperature dependency of mEPC frequency in control (n = 8 cells from 8 fish), DTg (n = 10 cells from 10 fish), and Baf A1-treated DTg (n = 10 cells from 10 fish). Temperature rise (from 25°C to 30°C) significantly increased the mEPC frequency in control (**p < 0.01, paired t test). M, Fold change in mEPC frequency resulting from temperature rise. In DTg, the temperature dependency of mEPC frequency was significantly decreased compared with control (*adjusted p < 0.05, one-way ANOVA followed by Bonferroni–Holm test). Baf A1 treatment had no effect in DTg (adjusted p = 0.98, one-way ANOVA followed by Bonferroni–Holm test). Error bars indicate ±SEM.

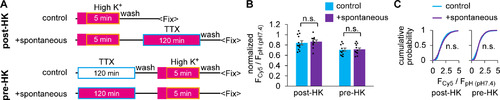
Spontaneously recycling SVs were included in the total recycling pool. A, Diagram represents the timeline of the sequential labeling experiment. Spontaneous SV labeling in TTX for 120 min was performed after (post-HK) or before (pre-HK) the evoked SV labeling in 5 min HK depolarization. Fish preparations were subjected to incubation with HL-Cy5 (magenta square) followed by HK depolarization (boxed in orange) or to incubation in the presence of TTX (boxed in blue). B, SV fraction labeled with HK only (control) or sequentially with both HK and TTX (+spontaneous) in post-HK labeling (n = 12 or 11 fish, respectively) and pre-HK labeling (n = 12 or 12 fish, respectively). No significant difference was observed between the two groups both in post-HK (p = 0.67, unpaired t test) and pre-HK (p = 0.90, unpaired t test) labeling. C, Average cumulative probability of FCy5/FpH (pH7.4) at individual ROIs from the data analyzed in B. No significant difference was observed between the two groups in both post-HK (p = 0.44, Kolmogorov–Smirnov test) and pre-HK (p = 0.32, Kolmogorov–Smirnov test).

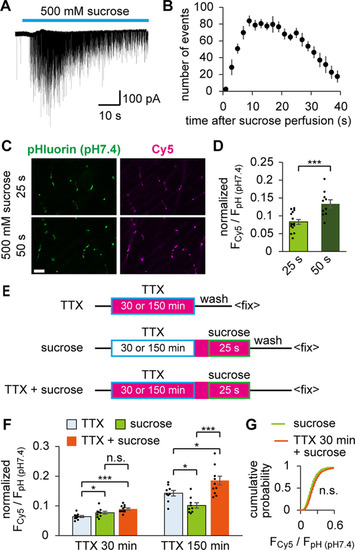
Spontaneously recycled SVs overlapped with RRP mobilized by hypertonic stimulation. A, A trace of the mEPC burst recorded during perfusion of 500 mm sucrose. Unlike in cultured neurons, individual mEPCs could be resolved. B, The numbers of mEPC events caused by 500 mm sucrose were counted in 2 s bins. The number of events decreased after 25 s. C, Confocal images of pHluorin (pH 7.4) and Cy5 at the NMJs, where HaloTag labeling was achieved by the hypertonic stimulation for 25 or 50 s. Scale bar, 10 μm. D, Labeled fractions during 25 s (n = 15 fish) or 50 s (n = 10 fish) hypertonic stimulation. Longer stimulation mobilized a larger fraction (***p < 0.001, unpaired t test). E, Diagram represents the timeline of sequential labeling experiments. In the first group (TTX), fish preparations were incubated with HL-Cy5 (magenta) in the presence of TTX (boxed in blue) for 30 or 150 min. In the second group (sucrose), TTX treatment for 30 or 150 min was followed by sucrose stimulation for 25 s (boxed in green) in HL-Cy5. In the third group (TTX+sucrose), the TTX treatment and sucrose stimulation were both performed in HL-Cy5. F, Labeled fractions obtained by the experiments shown in E. When the TTX treatment was 30 min, a measurable fraction was labeled in the TTX group (n = 9 fish). However, the TTX+sucrose group (n = 11 fish) did not significantly increase the labeled fraction compared with that in the sucrose group (n = 10 fish, adjusted p = 0.08, one-way ANOVA followed by Bonferroni–Holm test). In contrast, when the TTX treatment was extended to 150 min, the TTX+sucrose group (n = 11 fish) significantly increased the labeled fraction compared with that in the sucrose (n = 9 fish) and TTX groups (n = 9 fish). *Adjusted p < 0.05, ***adjusted p < 0.001, one-way ANOVA followed by Bonferroni–Holm test. G, Cumulative probability histogram of Fcy5/FpH (pH7.4) at individual ROIs in the TTX+sucrose or sucrose group (TTX treatment for 30 min in both groups), which were analyzed in F. No significant difference was seen (p = 0.20, Kolmogorov–Smirnov test). Error bars indicate ±SEM.

Spontaneously recycled SVs behaved like RRP vesicles in subsequent APs. A, Diagram represents HaloTag labeling with HL-cypHer5E, which allows SV imaging after the initial exocytosis. B, Confocal live images of pHluorin and cypHer5E at the NMJs before (resting) and after (stim) APs (20 Hz for 30 s). HL-cypHer5E was loaded by 3 min HK depolarization preceding the electrical stimulation. Scale bar, 10 μm. C, D, pHluorin fluorescence (C) and cypHer5E fluorescence (D) in response to APs (20 Hz for 30 s) measured at the NMJs prelabeled with HL-cypHer5E through 3 min HK depolarization (n = 12 experiments from 7 fish). The cypHer5E fluorescence, which is maximum at acidic pH, is not photostable; thus, its photobleaching was corrected (see Materials and Methods). E, cypHer5E fluorescence in response to APs (20 Hz for 30 s), where HL-cypHer5E was preloaded during 45-60 min incubation in TTX. Each trace is from an individual experiment. F, G, pHluorin fluorescence (F) and cypHer5E fluorescence (G) in response to APs (20 Hz for 30 s) measured at the NMJs preloaded with HL-cypHer5E during 45-60 min incubation in TTX (n = 20 experiments from 16 fish). H, The fraction of SVs exocytosed in the first 10 s of electrical stimulation was calculated for preloaded SVs (cypHer5E) and the total SVs (pHluorin). Preloading was performed either by HK stimulation or incubation in TTX. SVs preloaded in TTX fused significantly faster than that in total SVs (TTX 45-60 min; **p < 0.01, paired t test), which was not the case in SVs preloaded by HK (HK 3 min; p = 0.08, paired t test). Error bars indicate ±SEM.

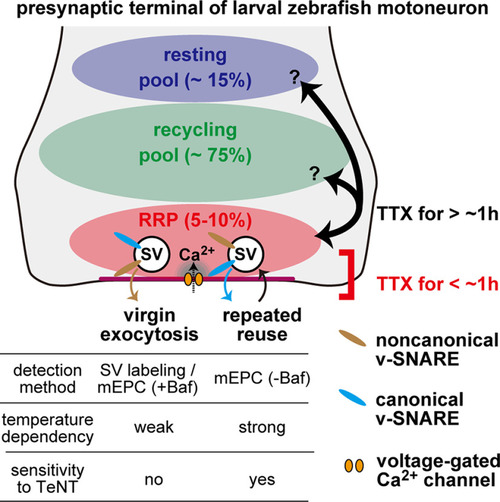
Summary diagram of spontaneous SV fusion at larval zebrafish neuromuscular synapses. Three pools of SVs are depicted: resting pool, recycling pool, and RRP. In the early phase of TTX treatment (<1 h), spontaneous SV fusion is mobilized from the RRP with two distinct modes: virgin exocytosis with a slow time course (τ = 45 min at 25°C) and repeated reuse of the same SVs at a higher rate. The differences between the two modes of fusion are highlighted in the table at bottom. SVs equipped with both canonical and noncanonical v-SNAREs are involved in the two modes, although their dependency on the noncanonical v-SNARE is not identical. They may also be different in their coupling to the voltage-gated Ca2+ channels. SVs in RRP are intermixed with those in other pools after a prolonged (>1 h) TTX treatment.

Acknowledgments
This image is the copyrighted work of the attributed author or publisher, and ZFIN has permission only to display this image to its users. Additional permissions should be obtained from the applicable author or publisher of the image. Full text @ J. Neurosci.