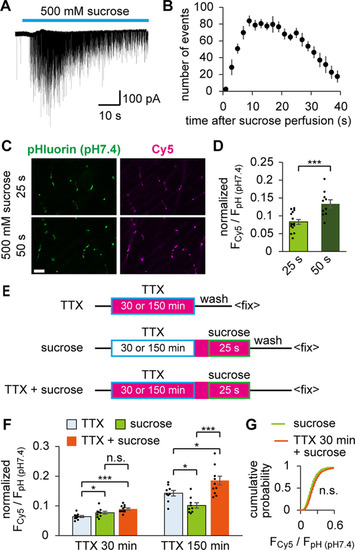
Spontaneously recycled SVs overlapped with RRP mobilized by hypertonic stimulation. A, A trace of the mEPC burst recorded during perfusion of 500 mm sucrose. Unlike in cultured neurons, individual mEPCs could be resolved. B, The numbers of mEPC events caused by 500 mm sucrose were counted in 2 s bins. The number of events decreased after 25 s. C, Confocal images of pHluorin (pH 7.4) and Cy5 at the NMJs, where HaloTag labeling was achieved by the hypertonic stimulation for 25 or 50 s. Scale bar, 10 μm. D, Labeled fractions during 25 s (n = 15 fish) or 50 s (n = 10 fish) hypertonic stimulation. Longer stimulation mobilized a larger fraction (***p < 0.001, unpaired t test). E, Diagram represents the timeline of sequential labeling experiments. In the first group (TTX), fish preparations were incubated with HL-Cy5 (magenta) in the presence of TTX (boxed in blue) for 30 or 150 min. In the second group (sucrose), TTX treatment for 30 or 150 min was followed by sucrose stimulation for 25 s (boxed in green) in HL-Cy5. In the third group (TTX+sucrose), the TTX treatment and sucrose stimulation were both performed in HL-Cy5. F, Labeled fractions obtained by the experiments shown in E. When the TTX treatment was 30 min, a measurable fraction was labeled in the TTX group (n = 9 fish). However, the TTX+sucrose group (n = 11 fish) did not significantly increase the labeled fraction compared with that in the sucrose group (n = 10 fish, adjusted p = 0.08, one-way ANOVA followed by Bonferroni–Holm test). In contrast, when the TTX treatment was extended to 150 min, the TTX+sucrose group (n = 11 fish) significantly increased the labeled fraction compared with that in the sucrose (n = 9 fish) and TTX groups (n = 9 fish). *Adjusted p < 0.05, ***adjusted p < 0.001, one-way ANOVA followed by Bonferroni–Holm test. G, Cumulative probability histogram of Fcy5/FpH (pH7.4) at individual ROIs in the TTX+sucrose or sucrose group (TTX treatment for 30 min in both groups), which were analyzed in F. No significant difference was seen (p = 0.20, Kolmogorov–Smirnov test). Error bars indicate ±SEM.
|
