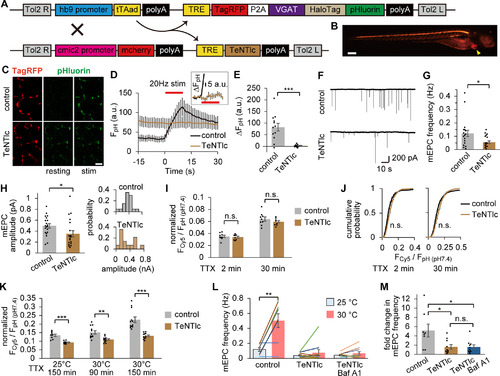
TeNT impaired the late-onset component of spontaneous SV labeling. A, Diagram represents transgene constructs for Tg (hb9:tTAad, TRE:TagRFP-P2A-VpHalo) and Tg (cmlc2:mcherry, TRE:TeNTlc) zebrafish. In the DTg fish, TeNTlc was expressed in addition to TagRFP and VpHalo in motoneurons via the Tet-Off system driven by the hb9 promoter. mcherry expressed in the heart by the cmlc2 promoter was used as a marker of the transgene. B, Fluorescent stereoscopic image of TagRFP and mcherry (arrowhead) in the DTg fish at 4 dpf. Scale bar, 200 μm. C, Confocal live images of pHluorin before (resting) and after (stim) APs at 20 Hz for 10 s in control or DTg fish. TagRFP fluorescence in the same region is also shown. Scale bar, 10 μm. D, pHluorin fluorescence in response to APs at the NMJs in control (n = 12 experiments from 6 fish) or DTg fish (n = 11 experiments from 6 fish). Inset, A magnified view of the fluorescence increase of DTg. E, Increases in fluorescence at the end of APs were significantly decreased in DTg fish (***p < 0.001, unpaired t test). F, Traces of mEPCs recorded from control or DTg fish. G, H, mEPC frequency (G) and amplitude (H) in control (n = 20 cells from 10 fish) or DTg fish (n = 20 cells from 10 fish). DTg fish showed significant reduction in both frequency (*p < 0.05, unpaired t test) and amplitude (*p < 0.05, unpaired t test). Right panels, Histograms of mEPC amplitudes recorded from representative cells. I, Spontaneously labeled fraction in control or DTg fish at 2 min (n = 9 or 8 fish, respectively) or 30 min (n = 9 or 9 fish, respectively) at 25°C. No significant difference was seen in 2 and 30 min labeling (p = 0.61 and 0.28, respectively, unpaired t test). J, Cumulative probability histogram of Fcy5/FpH (pH7.4) at individual ROIs from the data analyzed in H. No significant difference was seen both in 2 and 30 min labeling (p = 0.06 and 0.12, respectively, Kolmogorov–Smirnov test). K, Spontaneously labeled fraction in control or DTg fish over 150 min at 25°C (n = 9 or 9 fish, respectively), 90 min at 30°C (n = 12 or 12 fish, respectively), or 150 min at 30°C (n = 12 or 11 fish, respectively). The labeled fraction in DTg fish was significantly smaller than that of control in all conditions (**p < 0.01, ***p < 0.001, unpaired t test). L, Temperature dependency of mEPC frequency in control (n = 8 cells from 8 fish), DTg (n = 10 cells from 10 fish), and Baf A1-treated DTg (n = 10 cells from 10 fish). Temperature rise (from 25°C to 30°C) significantly increased the mEPC frequency in control (**p < 0.01, paired t test). M, Fold change in mEPC frequency resulting from temperature rise. In DTg, the temperature dependency of mEPC frequency was significantly decreased compared with control (*adjusted p < 0.05, one-way ANOVA followed by Bonferroni–Holm test). Baf A1 treatment had no effect in DTg (adjusted p = 0.98, one-way ANOVA followed by Bonferroni–Holm test). Error bars indicate ±SEM.
|
