IMAGE

Figure 2.

ID
ZDB-IMAGE-220505-55
Source
Figures for Egashira et al., 2022
Image
Figure Caption

Figure 2.

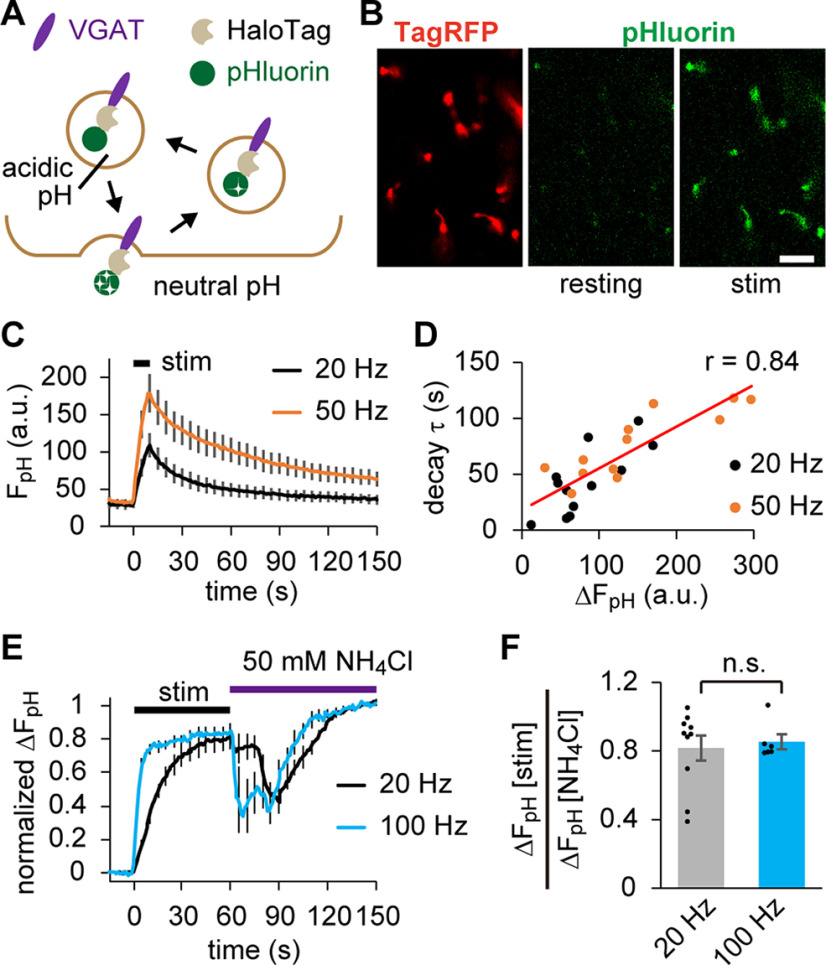
pHluorin live imaging indicated that SVs carrying VpHalo recycle normally in response to APs. A, Diagram represents changes in pHluorin fluorescence during recycling of SVs carrying VpHalo. B, Confocal live images of pHluorin before (resting) and after (stim) APs at 20 Hz for 10 s. The reporter TagRFP fluorescence in the same region is also shown. Scale bar, 10 μm. C, pHluorin fluorescence in response to APs at 20 Hz (n = 12 experiments from 7 fish) and 50 Hz (n = 12 experiments from 7 fish). D, Relationship between the AP-induced fluorescence increase (ΔFpH) and the decay time constant (decay τ). E, pHluorin fluorescence after Baf A1 treatment in response to APs at 20 Hz (n = 10 experiments from 10 fish) and 100 Hz (n = 6 experiments from 6 fish). To measure the maximal fluorescence, 50 mm NH4Cl was subsequently applied. F, ΔFpH [stim] normalized to the fluorescence achieved by NH4Cl application (ΔFpH [NH4Cl]). No significant difference was observed between the two groups (p = 0.72, unpaired t test). Error bars indicate ±SEM.

Acknowledgments
This image is the copyrighted work of the attributed author or publisher, and ZFIN has permission only to display this image to its users. Additional permissions should be obtained from the applicable author or publisher of the image. Full text @ J. Neurosci.