Figure Caption
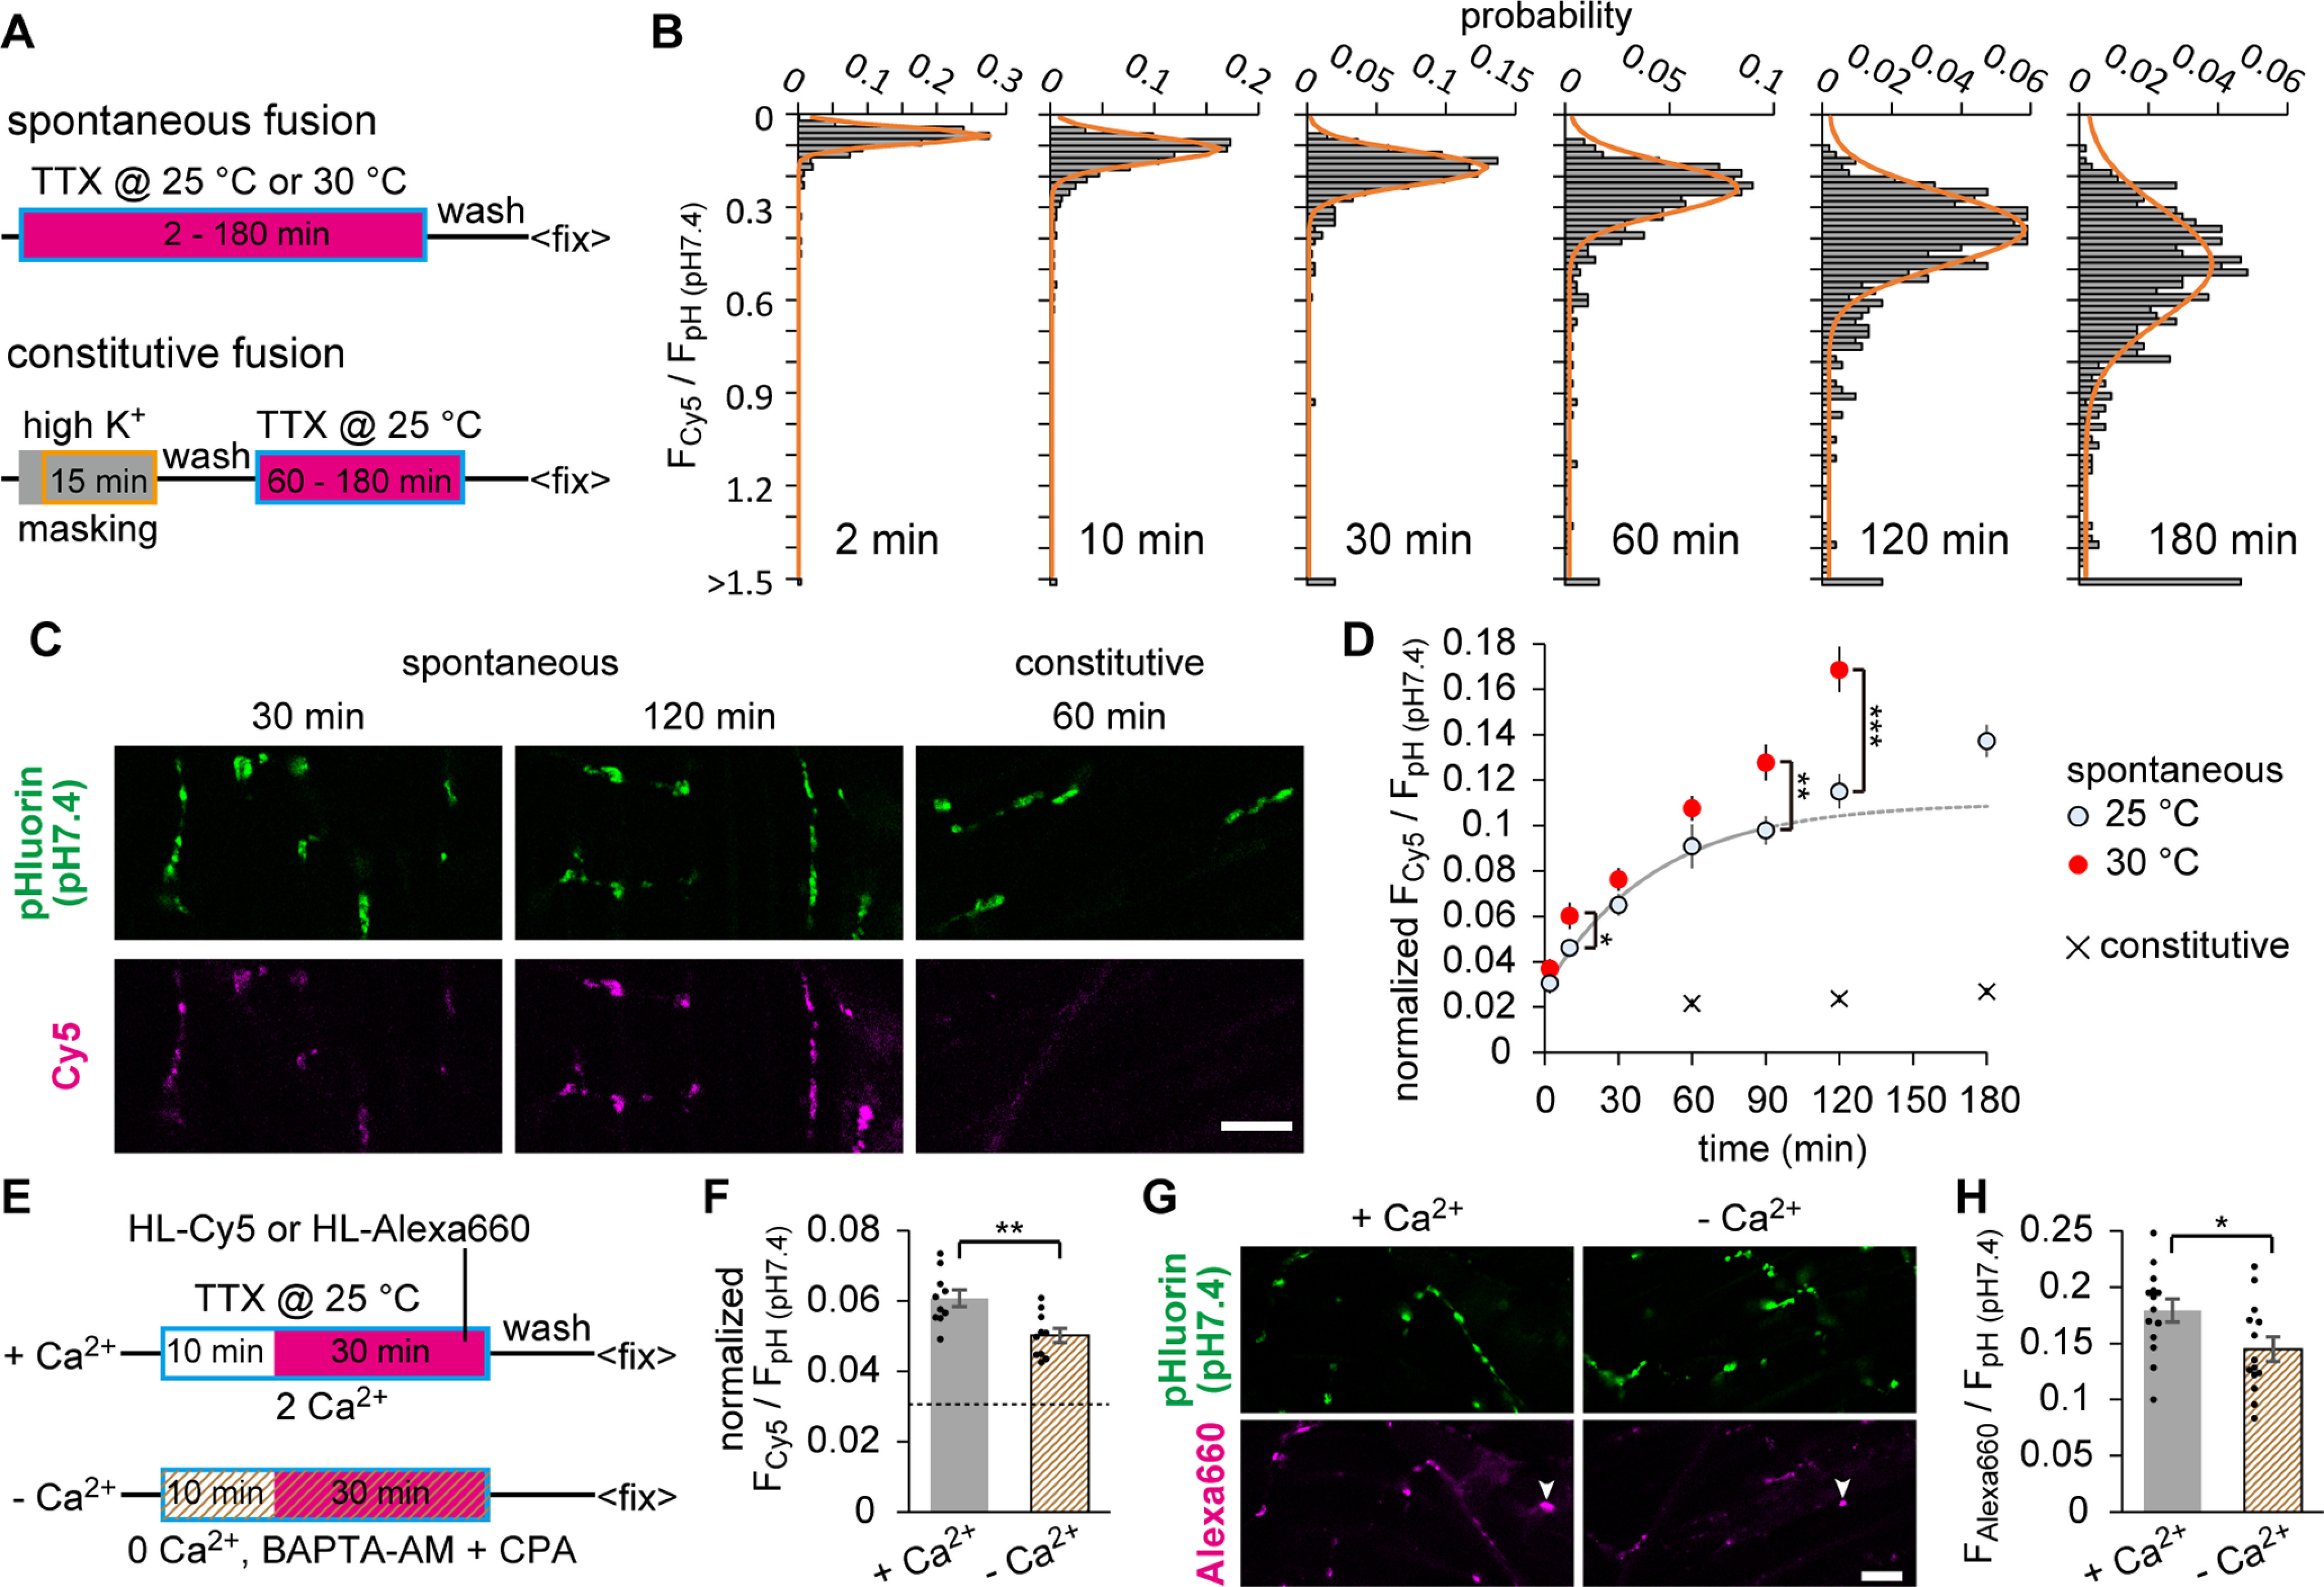
Figure 4.
HaloTag labeling of spontaneously recycled SVs suggested two distinct populations of spontaneous fusion. A, Diagram represents the timeline of labeling experiments. Fish preparations were subjected to incubation with HL-Cy5 (magenta square) in the presence of 1 μm TTX for 2-180 min (boxed in blue) at 25°C or 30°C (spontaneous fusion). In measuring the constitutive fusion of transported organelles (constitutive fusion), labeling was performed after HaloTags were first masked by HK depolarization (boxed in orange) in the nonfluorescent ligand (gray square). B, Distribution of FCy5/FpH (pH7.4) measured at individual ROIs. Fish preparations were labeled with HL-Cy5 in the presence of TTX at 25°C for 2 min (483 ROIs), 10 min (538 ROIs), 30 min (547 ROIs), 60 min (556 ROIs), 120 min (526 ROIs), or 180 min (537 ROIs). All histograms were fitted with Gaussian distribution (orange line). C, Confocal images of pHluorin (pH 7.4) and Cy5 at the NMJs. Labeling was achieved by spontaneous fusion for 30 or 120 min, or constitutive fusion for 60 min. Scale bar, 10 μm. D, Time-dependent accumulation of labeled fraction, indicated as Fcy5/FpH (pH7.4) normalized to the value obtained by full labeling. Spontaneous fusions were labeled at 25°C for 2, 10, 30, 60, 90, 120, and 180 min (n = 12, 13, 12, 12, 12, 12, and 8 fish, respectively), or at 30°C for 2, 10, 30, 60, 90, and 120 min (n = 9, 12, 12, 12, 11, and 8 fish, respectively). A single exponential fitting to the averaged data up to 90 min at 25°C is shown. Constitutive fusions were labeled at 25°C for 60, 120, and 180 min (n = 10 fish). Temperature rise resulted in a significant increase in the spontaneous labeling at 10, 90, and 120 min (*p < 0.05, **p < 0.01, ***p < 0.001, unpaired t test). E, Diagram represents the timeline of labeling experiments with or without Ca2+. Fish preparations were preincubated with 1 μm TTX (boxed in blue) in 2 mm Ca2+ solution (+Ca2+) or Ca2+ free solution containing 50 μm BAPTA-AM and 50 μm cyclopiazonic acid (–Ca2+) for 10 min, and then labeled with HL-Cy5 or HL-Alexa-660 (magenta square) for 30 min at 25°C. F, Spontaneously labeled fraction with HL-Cy5 during 30 min incubation in +Ca2+ (n = 10 fish) or –Ca2+ (n = 10 fish) condition. Dashed line indicates the value obtained by 2 min labeling at 25°C shown in D, which reflects background signal, including the surface fraction. The labeled fraction was significantly decreased with the removal of free Ca2+ (**p < 0.01, unpaired t test). G, Confocal images of pHluorin (pH 7.4) and HL-Alexa-660 at the NMJs. Scale bar, 10 μm. Nonspecific signals (arrowhead), presumably resulting from the dye aggregation, precluded normalization by the pooled data in H. H, Average FAlexa660/FpH (pH7.4) in +Ca2+ (n = 14 fish) or –Ca2+ (n = 14 fish) condition. Reduction by the Ca2+ removal was similar between HL-Cy5 and HL-Alexa-660 (*p < 0.05, unpaired t test). Error bars indicate ±SEM.
Acknowledgments
This image is the copyrighted work of the attributed author or publisher, and
ZFIN has permission only to display this image to its users.
Additional permissions should be obtained from the applicable author or publisher of the image.
Full text @ J. Neurosci.