
- Title
-
Augmentation of progestin signaling rescues testis organization and spermatogenesis in zebrafish with the depletion of androgen signaling
- Authors
- Zhai, G., Shu, T., Yu, G., Tang, H., Shi, C., Jia, J., Lou, Q., Dai, X., Jin, X., He, J., Xiao, W., Liu, X., Yin, Z.
- Source
- Full text @ Elife
( |
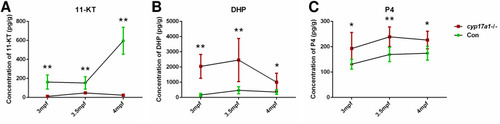
The 11-ketotestosterone (11-KT), 17α,20β-dihydroxy-4-pregnen-3-one (DHP), and progesterone (P4) measurements from whole-body lysates of the cyp17a1-/- fish and its control male siblings at 3 months post-fertilization (mpf), 3.5 mpf, and 4 mpf using ultra performance liquid chromatography tandem mass spectrometry (UPLC-MS/MS). (A) 11-KT, (B) DHP, and (C) P4. *p<0.05; **p<0.01. |
( |
( |
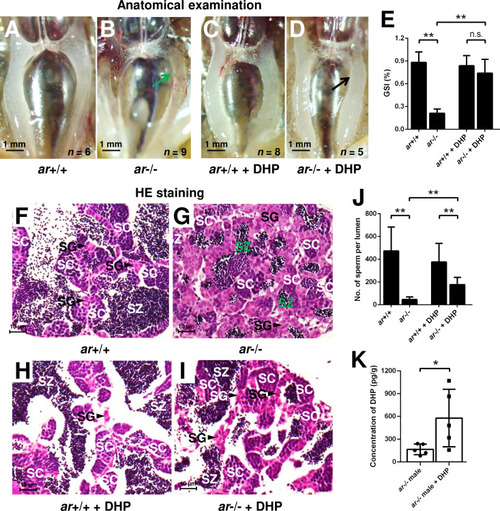
(A, B) Anatomical examination of ar+/+ males and ar-/- males reared in system water. (C, D) Anatomical examination of ar+/+ males and ar-/- males reared in DHP. Green and black arrows indicate the decreased and normal testis, respectively, in the ar-/- males. (E) Gridpoint Statistical Interpolation (GSI) from ar+/+ males and ar-/- males reared in system water and DHP, respectively. (F, G) Histological analyses of testes from ar+/+ males and ar-/- males reared in system water. (H, I) Histological analyses of testes from ar+/+ males and ar-/- males reared in DHP. (J) Statistical analysis of the spermatozoa (SZ) number in each lumen of seminiferous tubules from the ar+/+ males and ar-/- males reared in system water and DHP, respectively. (K) The DHP concentrations measurement of the ar-/- males reared in system water and DHP, respectively. *p<0.05; **p<0.01. n.s., no significance; SC: spermatocytes; SG: spermatogonia. |
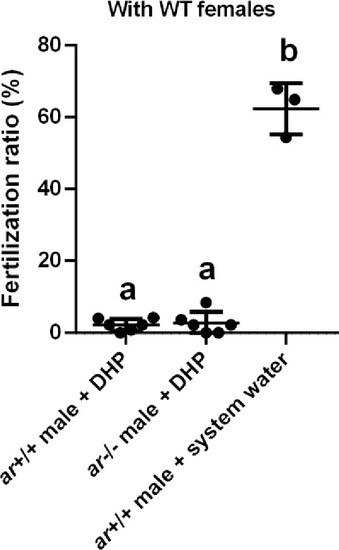
The fertilization ratio analysis. The fertilization ratios of ar+/+ males and ar-/- males after the 17α,20β-dihydroxy-4-pregnen-3-one (DHP) treatment, and ar+/+ males reared in the system water at 3 months post-fertilization (mpf) were assessed by artificial fecundation with wild-type (WT) females. |
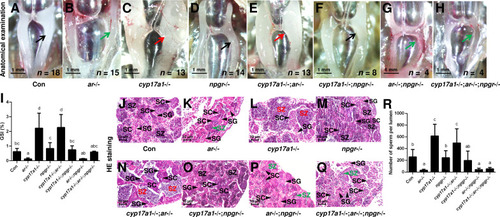
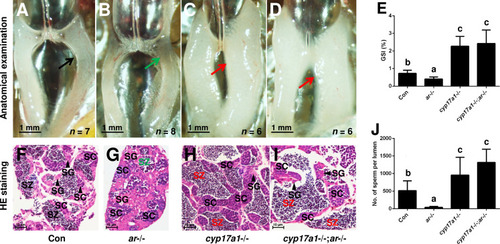
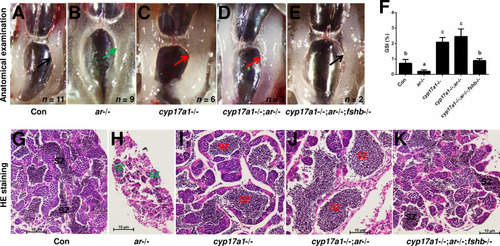
(A–H) Anatomical examination of the testes of control males, ar-/- males, cyp17a1-/- fish, npgr-/- males, cyp17a1-/-;ar-/- fish, cyp17a1-/-;npgr-/- fish, ar-/-;npgr-/- males, and cyp17a1-/-;ar-/-;npgr-/- fish at 6 months post-fertilization (mpf). Black and green arrows indicate the normal and impaired testis in control males, ar-/- males, npgr-/- males, cyp17a1-/-;npgr-/- fish, ar-/-;npgr-/- males, and cyp17a1-/-;ar-/-;npgr-/- fish, respectively, whereas the red arrows indicate the hypertrophic testis in the cyp17a1-/- fish and cyp17a1-/-;ar-/- fish. (I) Gridpoint Statistical Interpolation (GSI) from the fish of the eight genotypes at 6 mpf. (J–Q) Histological analyses of the testes from the fish of the eight genotypes at 6 mpf. Black and green letters indicate the normal and decreased number of spermatozoa (SZ) in control males, ar-/- males, npgr-/- males, cyp17a1-/-;npgr-/- fish, ar-/-;npgr-/- males, and cyp17a1-/-;ar-/-;npgr-/- fish, respectively, whereas the red letters of SZ indicate the increased number of SZ in the cyp17a1-/- fish and cyp17a1-/-;ar-/- fish. (R) Statistical analysis of the SZ number in each lumen of seminiferous tubules from the fish of the eight genotypes at 6 mpf. The letters in the bar charts (I) and (R) represent significant differences. SC: spermatocytes; SG: spermatogonia.
|
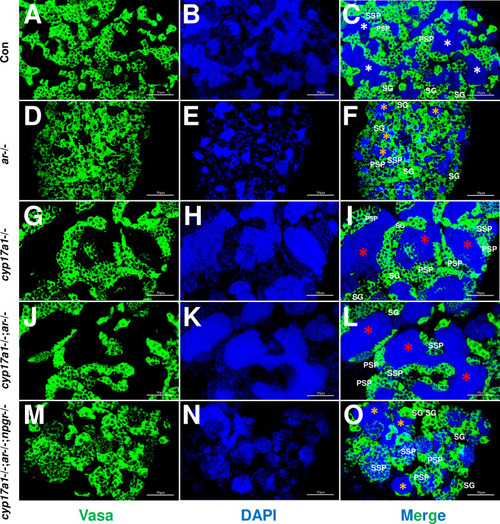
(A–C) Control male. (D–F) ar-/- male. (G–I) cyp17a1-/- fish. (J–L) cyp17a1-/-;ar-/- fish. (M–O) cyp17a1-/-;ar-/-;npgr-/- fish. Nuclear DNA was stained with 4',6-diamidino-2-phenylindole (DAPI). White and yellow asterisks in panels (C), (F), and (O) indicate the normal and decreased number of spermatozoa (SZ), respectively, whereas the red asterisks in panels (I) and (L) indicate the increased number of SZ in each lumen of seminiferous tubule. SG: spermatogonia; PSP: primary spermatocyte; SSP: secondary spermatocyte.
|
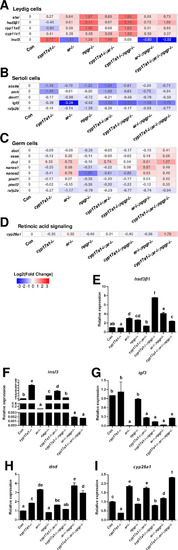
(A–D) Heatmap of the candidate genes. (A) The heatmap of star, hsd3β1, cyp11a2, cyp11c1, and insl3 of Leydig cells. (B) The heatmap of sox9a, amh, dmrt1, igf3, and rxfp2b of Sertoli cells. (C) The heatmap of dazl, vasa, dnd, nanos1, nanos2, piwil1, piwil2, and rxfp2a (another receptor of Insl3) of germ cells. (D) The expression of the retinoic acid-degrading enzyme, cyp26a1. (E–H) The expression of the selected genes with qPCR for confirmation of transcriptome analyses. (E) hsd3β1. (F) insl3. (G) igf3. (H) dnd. (I) cyp26a1. The letters in the bar charts represent significant differences.
|
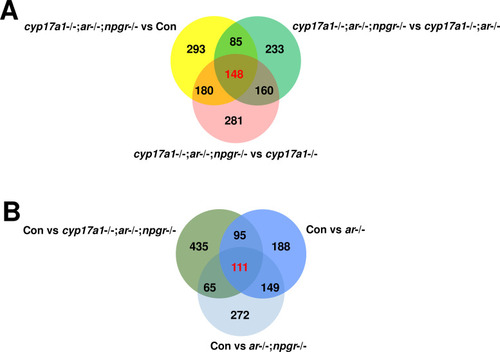
(A) The comparison of the dataset between cyp17a1-/-;ar-/-;npgr-/- fish and control males, cyp17a1-/-;ar-/- fish, and cyp17a1-/- fish, respectively. (B) The comparison of the dataset between control males and ar-/- males, ar-/-;npgr-/- males, and cyp17a1-/-;ar-/-;npgr-/- fish, respectively. The number represents the genes that were differentially expressed (p<0.05). The number highlighted in red represents the genes that were differentially expressed (p<0.05) in the three comparison groups. The numbers shown in black represent the genes that were differentially expressed (p<0.05) in only one or two comparison groups. The lists of the differentially expressed genes in the overlapped region are available in Supplementary file 1.
|
(A–E) Anatomical examination of the testes from control males, ar-/- males, cyp17a1-/- fish, cyp17a1-/-;ar-/- fish, and cyp17a1-/-;ar-/-;fshβ-/- fish at 6 mpf. Black and green arrows indicate the normal and decreased size of testes in control males and cyp17a1-/-;ar-/-;fshβ-/- fish, and ar-/- males, respectively, whereas the red arrows indicate the hypertrophic testis in the cyp17a1-/- fish and cyp17a1-/-;ar-/- fish. (F) Gridpoint Statistical Interpolation (GSI) from fish of the five genotypes at 6 mpf. The letters in bar chart (F) represent significant differences. (G–K) Histological analyses of the testes from control males, ar-/- males, cyp17a1-/- fish, cyp17a1-/-;ar-/- fish, and cyp17a1-/-;ar-/-;fshβ-/- fish at 6 mpf. Black and green letters indicate the normal and decreased number of spermatozoa (SZ) in control males and cyp17a1-/-;ar-/-;fshβ-/- fish, and ar-/- males, respectively, whereas the red letters indicate the increased number of SZ in the cyp17a1-/- fish and cyp17a1-/-;ar-/- fish.
|
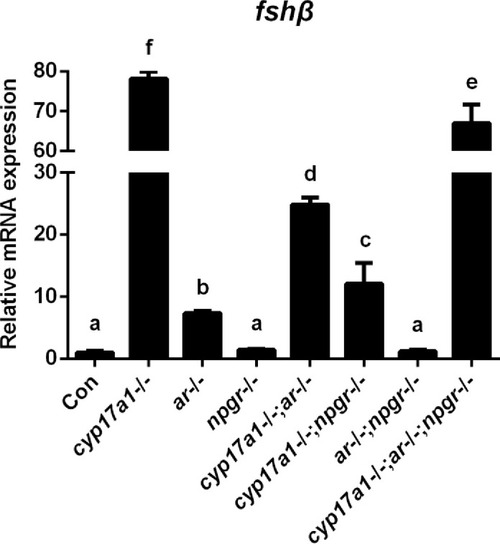
Expression analysis of pituitary fshβ in the control males, cyp17a1-/- fish, ar-/- males, npgr-/- males, cyp17a1-/-;ar-/- fish, cyp17a1-/-;npgr-/- fish, ar-/-;npgr-/- males, and cyp17a1-/-;ar-/-;npgr-/- fish at 6 months post-fertilization (mpf). The letters in the bar chart represent significant differences. |
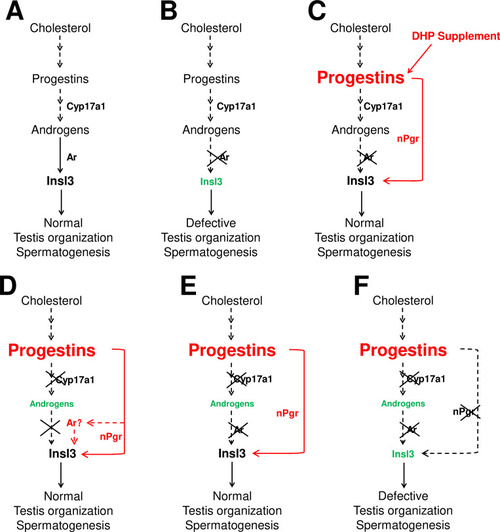
(A) Androgen signaling is essential in promoting testis organization and spermatogenesis in the control males. (B) Testis organization and spermatogenesis is impaired in the ar-/- males. (C) The impaired testis organization and spermatogenesis in the ar-/- males could be rescued by 17α,20β-dihydroxy-4-pregnen-3-one (DHP) supplement. (D) Testis organization and spermatogenesis proceeded normally in the cy17a1-/- fish, resulting from the enhanced progestin signaling caused by cyp17a1 depletion. (E) The alternative compensatory pathway induced by cyp17a1 depletion is ar-independent. (F) The alternative compensatory pathway induced by cyp17a1 depletion is npgr-dependent, demonstrating a high progestin/nuclear progestin receptor (nPgr) signaling pathway in promoting testis organization and spermatogenesis independent of androgen signaling. Red letters and lines indicate the upregulation of the progestin/nPgr signaling pathway, while green letters indicate the decreased concentration of androgens or downregulated insl3. The dotted lines indicate the brief description with omission or the potential existence of the proposed model.
|