
Figure 4
- ID
- ZDB-FIG-220313-7
- Publication
- Zhai et al., 2022 - Augmentation of progestin signaling rescues testis organization and spermatogenesis in zebrafish with the depletion of androgen signaling
- Other Figures
- All Figure Page
- Back to All Figure Page
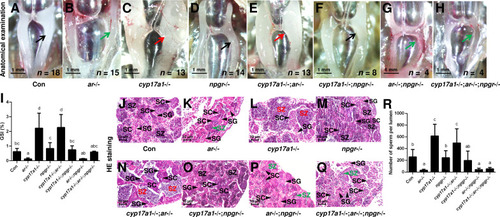
(A–H) Anatomical examination of the testes of control males, ar-/- males, cyp17a1-/- fish, npgr-/- males, cyp17a1-/-;ar-/- fish, cyp17a1-/-;npgr-/- fish, ar-/-;npgr-/- males, and cyp17a1-/-;ar-/-;npgr-/- fish at 6 months post-fertilization (mpf). Black and green arrows indicate the normal and impaired testis in control males, ar-/- males, npgr-/- males, cyp17a1-/-;npgr-/- fish, ar-/-;npgr-/- males, and cyp17a1-/-;ar-/-;npgr-/- fish, respectively, whereas the red arrows indicate the hypertrophic testis in the cyp17a1-/- fish and cyp17a1-/-;ar-/- fish. (I) Gridpoint Statistical Interpolation (GSI) from the fish of the eight genotypes at 6 mpf. (J–Q) Histological analyses of the testes from the fish of the eight genotypes at 6 mpf. Black and green letters indicate the normal and decreased number of spermatozoa (SZ) in control males, ar-/- males, npgr-/- males, cyp17a1-/-;npgr-/- fish, ar-/-;npgr-/- males, and cyp17a1-/-;ar-/-;npgr-/- fish, respectively, whereas the red letters of SZ indicate the increased number of SZ in the cyp17a1-/- fish and cyp17a1-/-;ar-/- fish. (R) Statistical analysis of the SZ number in each lumen of seminiferous tubules from the fish of the eight genotypes at 6 mpf. The letters in the bar charts (I) and (R) represent significant differences. SC: spermatocytes; SG: spermatogonia.
|