Zhai et al., 2022 -
Augmentation of progestin signaling rescues testis organization and spermatogenesis in zebrafish with the depletion of androgen signaling
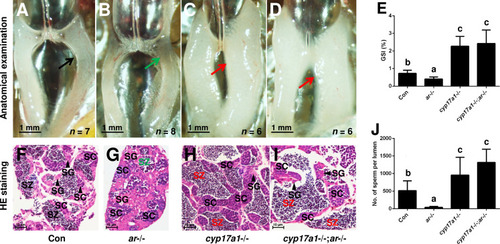
The alternative compensatory pathway induced by <italic toggle='yes'>cyp17a1</italic> depletion is <italic toggle='yes'>ar</italic>-independent.
(A–D) Anatomical examination of the testes from control males, ar-/- males, cyp17a1-/- fish, and cyp17a1-/-;ar-/- fish at 6 months post-fertilization (mpf). Black and green arrows indicate the normal and impaired testis in control males and ar-/- males, respectively, whereas the red arrows indicate the hypertrophic testis in the cyp17a1-/- fish and cyp17a1-/-;ar-/- fish. (E) Gridpoint Statistical Interpolation (GSI) from the fish of the four genotypes at 6 mpf. (F–I) Histological analyses of the testes from control males, ar-/- males, cyp17a1-/- fish, and cyp17a1-/-;ar-/- fish at 6 mpf. Black and green letters of spermatozoa (SZ) indicate the normal and decreased number of SZ in control males and ar-/- males, respectively, whereas the red letters of SZ indicate the increased number of SZ in the cyp17a1-/- fish and cyp17a1-/-;ar-/- fish. (J) Statistical analysis of the SZ number in each lumen of seminiferous tubules from the fish of the four genotypes at 6 mpf. The letters in the bar charts (E) and (J) represent significant differences. SC: spermatocytes; SG: spermatogonia.
GSI data (<xref rid='fig1' ref-type='fig'>Figure 1E</xref>) and number of sperm per lumen (<xref rid='fig1' ref-type='fig'>Figure 1J</xref>).
Expression Data
Expression Detail
Antibody Labeling
Phenotype Data
Phenotype Detail
Acknowledgments
This image is the copyrighted work of the attributed author or publisher, and
ZFIN has permission only to display this image to its users.
Additional permissions should be obtained from the applicable author or publisher of the image.
Full text @ Elife
Your Input Welcome
Thank you for submitting comments. Your input has been emailed to ZFIN curators who may contact you if
additional information is required.
Oops. Something went wrong. Please try again later.