
Figure 6—figure supplement 1.
- ID
- ZDB-FIG-220313-10
- Publication
- Zhai et al., 2022 - Augmentation of progestin signaling rescues testis organization and spermatogenesis in zebrafish with the depletion of androgen signaling
- Other Figures
- All Figure Page
- Back to All Figure Page
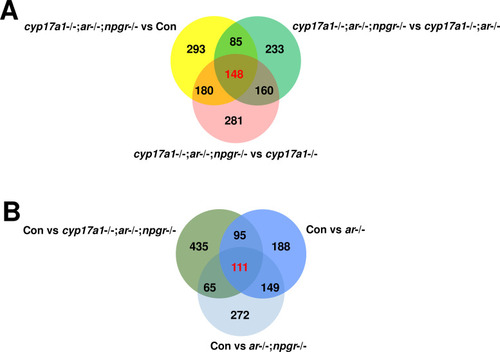
(A) The comparison of the dataset between cyp17a1-/-;ar-/-;npgr-/- fish and control males, cyp17a1-/-;ar-/- fish, and cyp17a1-/- fish, respectively. (B) The comparison of the dataset between control males and ar-/- males, ar-/-;npgr-/- males, and cyp17a1-/-;ar-/-;npgr-/- fish, respectively. The number represents the genes that were differentially expressed (p<0.05). The number highlighted in red represents the genes that were differentially expressed (p<0.05) in the three comparison groups. The numbers shown in black represent the genes that were differentially expressed (p<0.05) in only one or two comparison groups. The lists of the differentially expressed genes in the overlapped region are available in Supplementary file 1.
|