
|
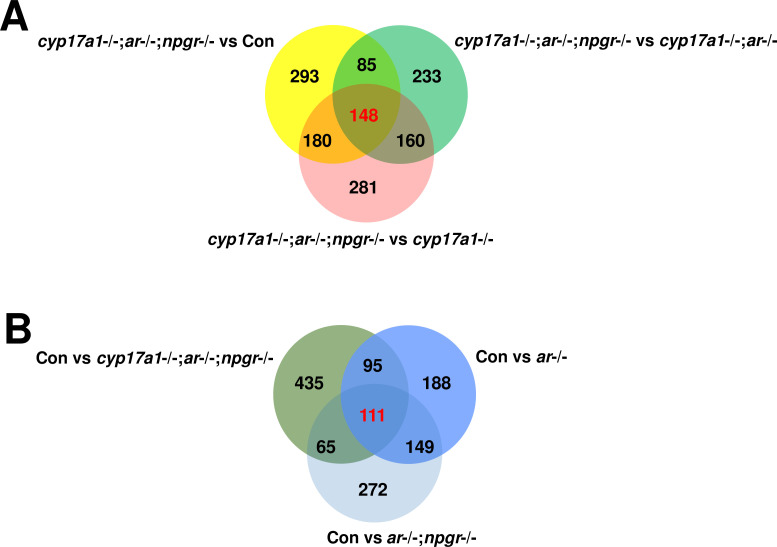
Figure 6—figure supplement 1.
(A) The comparison of the dataset between cyp17a1-/-;ar-/-;npgr-/- fish and control males, cyp17a1-/-;ar-/- fish, and cyp17a1-/- fish, respectively. (B) The comparison of the dataset between control males and ar-/- males, ar-/-;npgr-/- males, and cyp17a1-/-;ar-/-;npgr-/- fish, respectively. The number represents the genes that were differentially expressed (p<0.05). The number highlighted in red represents the genes that were differentially expressed (p<0.05) in the three comparison groups. The numbers shown in black represent the genes that were differentially expressed (p<0.05) in only one or two comparison groups. The lists of the differentially expressed genes in the overlapped region are available in Supplementary file 1.
Venn diagram of gene expression profiles in testes.