
Image
|
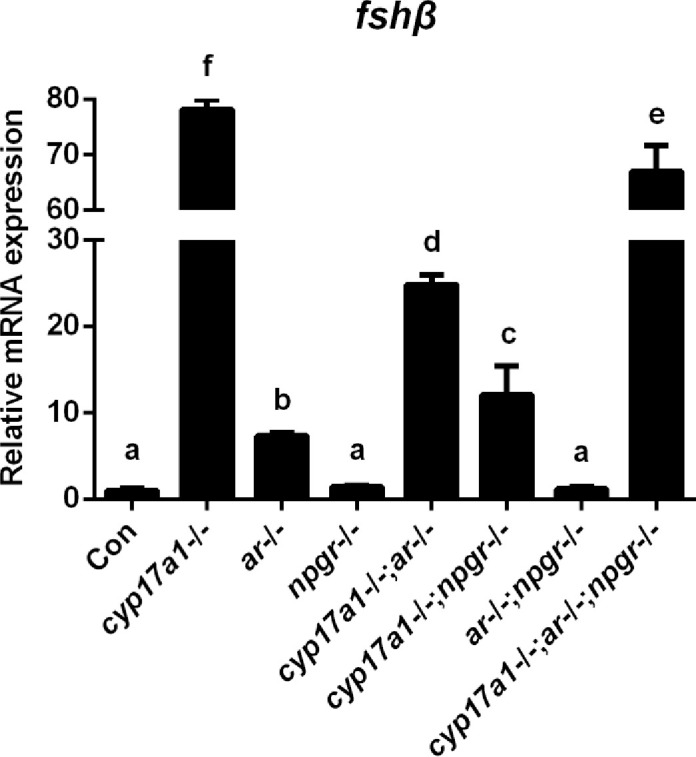
Figure Caption
Figure 6—figure supplement 3
Expression analysis of pituitary fshβ in the control males, cyp17a1-/- fish, ar-/- males, npgr-/- males, cyp17a1-/-;ar-/- fish, cyp17a1-/-;npgr-/- fish, ar-/-;npgr-/- males, and cyp17a1-/-;ar-/-;npgr-/- fish at 6 months post-fertilization (mpf). The letters in the bar chart represent significant differences.
Acknowledgments
This image is the copyrighted work of the attributed author or publisher, and
ZFIN has permission only to display this image to its users.
Additional permissions should be obtained from the applicable author or publisher of the image.
Full text @ Elife