
- Title
-
Aging Activates the Immune System and Alters the Regenerative Capacity in the Zebrafish Heart
- Authors
- Reuter, H., Perner, B., Wahl, F., Rohde, L., Koch, P., Groth, M., Buder, K., Englert, C.
- Source
- Full text @ Cells
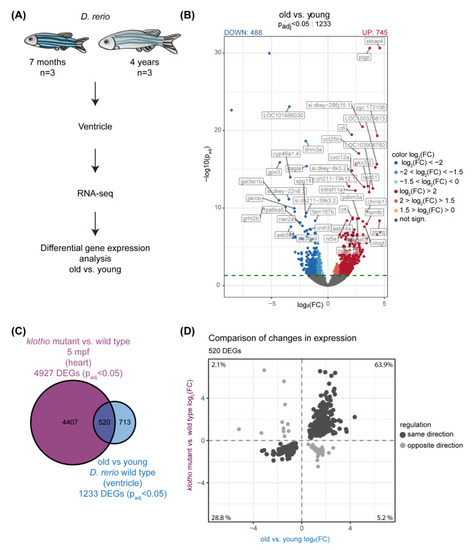
Transcriptional analysis identifies global changes in the aging zebrafish heart. (A) Scheme illustrating our transcriptome profiling approach with ventricles of 7-months (young) and 4-year (old) old zebrafish. n = 3. (B) Volcano plot illustrating differential gene expression (DEG) analysis that identified 1233 differentially expressed genes (DEGs); padj < 0.05 (dotted line). DEGs down-regulated in old vs. young are highlighted in blue (488), DEGs up-regulated in red (745). Gene symbols of top 50 DEGs (most significantly changed) are shown. FC: fold change. (C) Comparison DEGs in old vs. young with DEGs in hearts of klotho mutant vs. wild type [32] identifies 520 overlapping genes (D) 92.7% of 520 overlapping genes (in dark grey) are regulated in the same direction in old vs. young and mutant vs. wild type. |
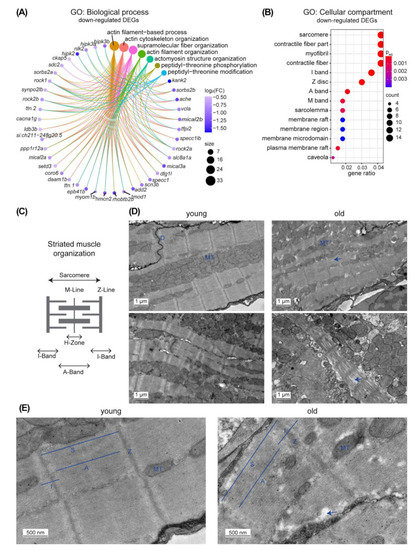
Expression of genes related to the actin filament is changed upon aging. (A) Circular plot illustrates the GO terms of the category “biological process” identified as enriched among 488 down regulated DEGs and the respective genes associated with these terms. The size of the GO term circle indicates the number of the genes and the color of the gene circle indicates the fold change (log2(FC)) in blue shades. Actin-related terms are prominent. (B) Dot plot indicates GO terms of the category “cellular compartments” that are enriched among the 488 down regulated DEGs. The size of the circle indicates the number of the genes, the color the adjusted p-value of the GO term analysis. Terms related to muscle structures are prominent. (C) Scheme of the striated muscle organization. (D) Electron microscopy pictures of the ventricle of 1-year-old (young) and 5-year-old (old) fish indicate changes in muscle organization in old. Scale bars: 1 µm. (E) Higher magnification picture of striated muscle organization in young and old. Scale bars: 500 nm. D: Desmosome; MT: Mitochondria; S: Sarcomere; I: I-Band; A: A-Band; Z: Z-Line. Arrows indicate to less dense muscle structures in old. |
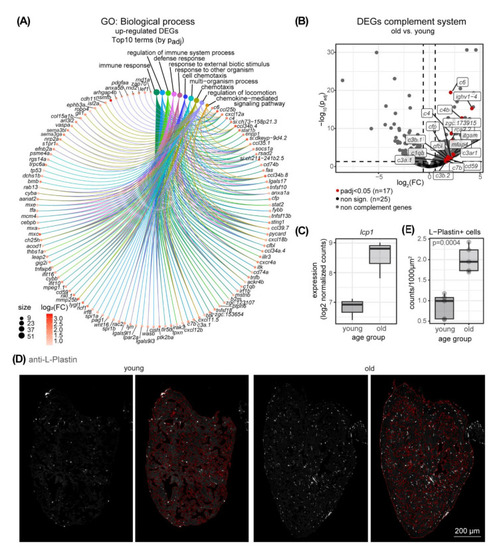
Expression of genes related to the immune system is changed upon aging. (A) Circular plot highlights the top 10 (by adjusted p-value) GO terms of the category “biological process” identified as enriched among 745 upregulated DEGs and the respective genes associated to these terms. The size of the GO term circle indicates the number of the genes and the color of the gene circle indicates the fold change (log2(FC)) in red shades. Immune system-related terms are prominent. (B) DEGs encoding components of the complement system are highlighted FC: fold change (C) Expression of the pan leukocyte marker gene lcp1 as log2 of normalized counts in young and old ventricles. n = 3. (D) Immunostaining of heart sections of old (37 months) and young (8 months) fish for the pan-leukocyte marker L-Plastin. The muscle tissue area that was segmented using ZEN Intellesis, is indicated in red in the respective right panels. Scale bar is 200 µm. (E) Quantification of L-Plastin-positive cells (from (D)) as counts per 1000 µm2 muscle area. n = 5; two-sample t-test p = 0.0004. |
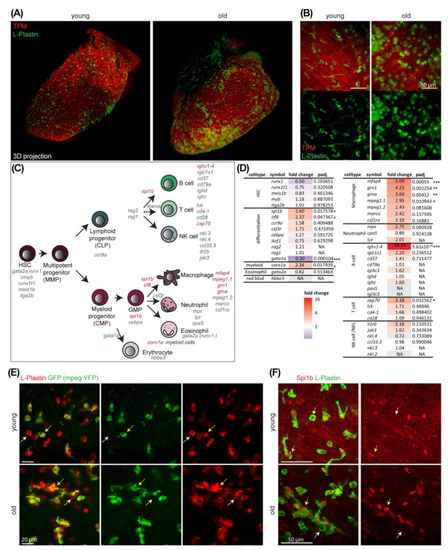
Immune cells accumulate in ventricles upon aging. (A) Whole-mount immunostaining of old (4 years) and young (1 year) fish hearts for the pan-leukocyte marker L-Plastin (green) and the muscle marker Tropomyosin (TPM) (red) are shown. Lightsheet microscopy and 3D projection reveal increased cell numbers and cell cluster formation in old hearts. (B) Higher magnification images of old and young hearts stained with L-Plastin (green) and TPM (red) reveals that immune cell numbers increase and cell morphology changes to be more roundish in old hearts. Scale bar: 50 µm. Whole-mount immunostaining and lightsheet microscopy. (C) Scheme of different immune cell types and their respective lineages in zebrafish. Known marker genes for different cell populations as well as for differentiation into specialized cell types are listed. Genes with significantly up or down regulated expression in old are highlighted in red or blue, respectively. (D) Immune cell markers (from (C)), their respective fold change with age and adjusted p-value (padj) are listed (transcriptional profiling from Figure 1, n = 3). Fold change values are color-coded with up in red, no change white and down in blue. NA: not available. *: padj < 0.05; **: padj < 0.01, ***: padj < 0.001 (E) Whole-mount immunostaining of young (1 year) and old (3 years) fish hearts of a mpeg:YFP reporter line for the pan-leukocyte marker L-Plastin (red) and GFP (green) reveals that a large subset of L-Plastin+ cells are mpeg-positive. White arrow indicates a single positive immune cell and yellow arrow indicates a double positive cell. Lightsheet microscopy. Scale bars: 20 µm. (F) Whole-mount immunostaining of young (1 year) and old (4 years) fish hearts for the pan-leukocyte marker L-Plastin (green) and Spi1b (red) reveal large subset of L-Plastin cells are Spi1b-positive. White arrow indicates a single positive immune cell and yellow arrow indicates a double positive cell. Lightsheet microscopy. Scale bars: 50 µm. |
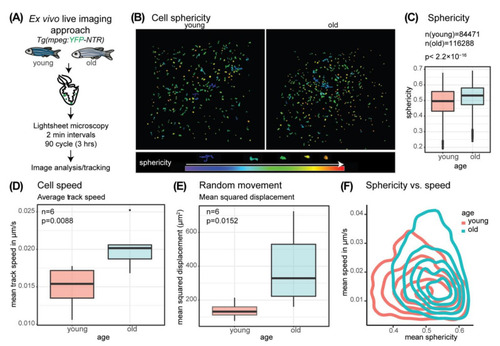
Macrophage morphology and behavior changes with age. (A) Schematic overview of the ex vivo live imaging approach using a reporter line expressing YFP under the control of the mpeg1.1 promoter (B) Sphericity of segmented and tracked objects (mpeg+ cells) at timepoint (tp) = 1 is color coded with red as high sphericity (round) and purple/blue as low sphericity. Age young: 12 months, age old: 4 years 7 months. The legend includes a color code for sphericity and representative example cell shapes. (C) Comparison of sphericity of all tracked objects (mpeg+ cells) at all time points analyzed in old and young fish hearts reveals a significant shift to higher average cell sphericity in the old. Welch two-sample t-test p < 2.2 × 10⁻¹⁶, age young: 3 × 6 months and 3 × 12 months, age old: 3 × 4 years 7 months and 3 × 5 years. (D) The boxplot illustrates the mean track speed of all segmented tracks analyzed per biological replicate. 6 old and 6 young hearts were analyzed. Quantification of average speed of mpeg+ cells in old and young fish ventricles indicate a faster cell movement in old. n = 6; two-sample t-test p = 0.0088, age young: 3 × 6 months and 3 × 12 months, age old: 3 × 4 years 7 months and 3 × 5 years. (E) The boxplot illustrates the average mean squared displacement analyzed per heart of 6 old and 6 young hearts. Quantification of mean squared displacement of mpeg+ cells in old and young ventricles reveals a higher random movement in old. n = 6, Wilcoxon rank sum test p = 0.0152, age young: 3 × 6 months and 3 × 12 months, age old: 3 × 4 years 7 months and 3 × 5 years. (F) Density plot showing the average cell sphericity per track vs. average speed per track reveals a shift of cell populations in old towards more roundish and to faster cells. |
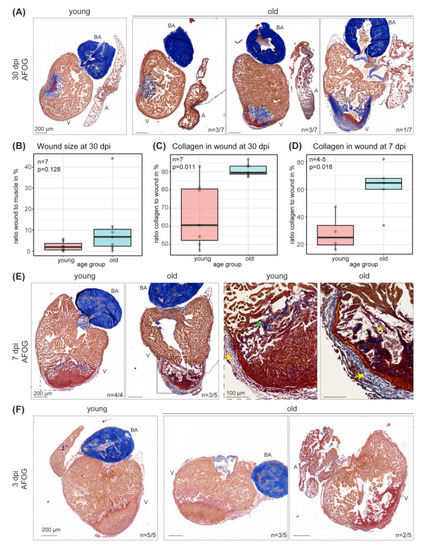
Wound size, regeneration response and collagen deposition changes upon cryoinjury in old compared to young hearts. (A) Acid fuchsin orange G (AFOG) staining of representative sections of young and old hearts 30 dpi visualizes the scar area in red (fibrin) and blue (collagen). Intact muscle is stained in orange. Scars display strong differences within the old (3 years 10 months) population as compared to young (1 year 4 months). 4 out of 7 old fish show differences in the injury response compared to young. Scale bars: 200 µm. (B) Quantification of the wound as percentage of intact muscle at 30 dpi (from (A)). n = 7. Wilcoxon rank sum test p = 0.128. (C) Quantification of collagen in wound (in %) at 30 dpi (from A). n = 7. Wilcoxon rank sum test p = 0.0111. (D) Quantification of collagen in wounds (in %) at 7 dpi (from (E)). n (young) = 4; n (old) = 5; two-sample t-test p = 0.0177. (E) AFOG staining of sections of young (1 year 2 months) and old (4 years 4 months) hearts 7 dpi visualizes the scar area. Scars display differences in young and old (3 out of 5 old). Yellow arrow points towards thickened collagen layer in the region of the epicard. Green arrow points towards collagen accumulation at the wound border in young. Yellow asterisk marks loosened muscle structure. Scale bars: 200 µm in overview and 100 µm in zoom-in. (F) AFOG staining of sections of young (9 months) and old (3 years 2 months) hearts 3 dpi visualizes the injured area. A subset of old animals (2 out of 5) show differences in the injury response. Scale bars: 200 µm. A: atrium; BA: bulbus arteriosus; V: ventricle. dpi: days post cryoinjury. |