
|
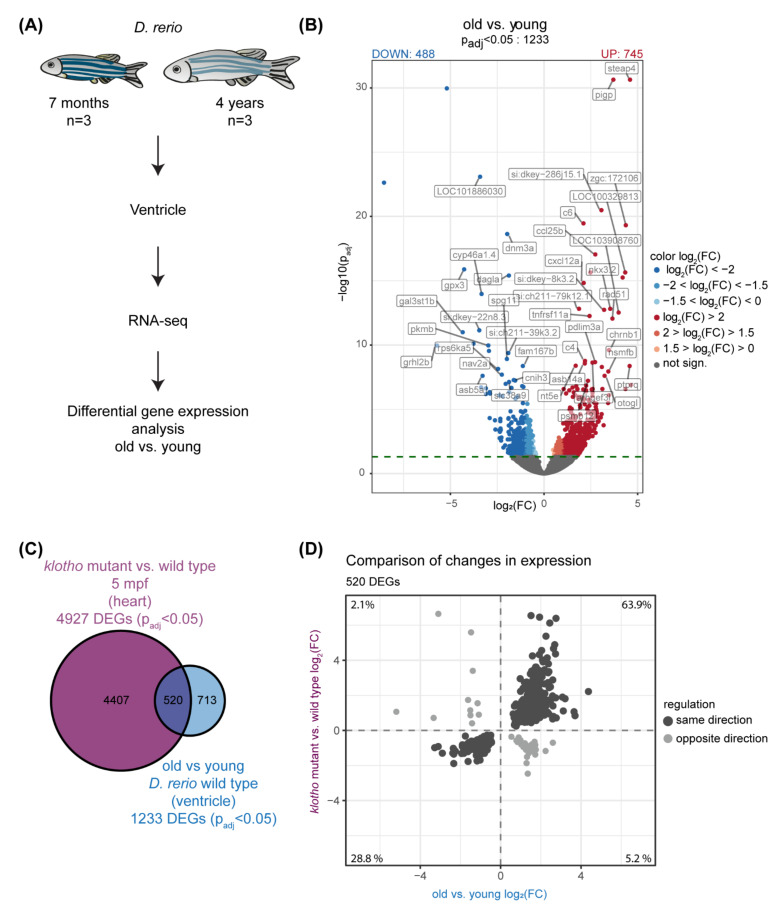
Figure 1
Transcriptional analysis identifies global changes in the aging zebrafish heart. (A) Scheme illustrating our transcriptome profiling approach with ventricles of 7-months (young) and 4-year (old) old zebrafish. n = 3. (B) Volcano plot illustrating differential gene expression (DEG) analysis that identified 1233 differentially expressed genes (DEGs); padj < 0.05 (dotted line). DEGs down-regulated in old vs. young are highlighted in blue (488), DEGs up-regulated in red (745). Gene symbols of top 50 DEGs (most significantly changed) are shown. FC: fold change. (C) Comparison DEGs in old vs. young with DEGs in hearts of klotho mutant vs. wild type [32] identifies 520 overlapping genes (D) 92.7% of 520 overlapping genes (in dark grey) are regulated in the same direction in old vs. young and mutant vs. wild type.