
|
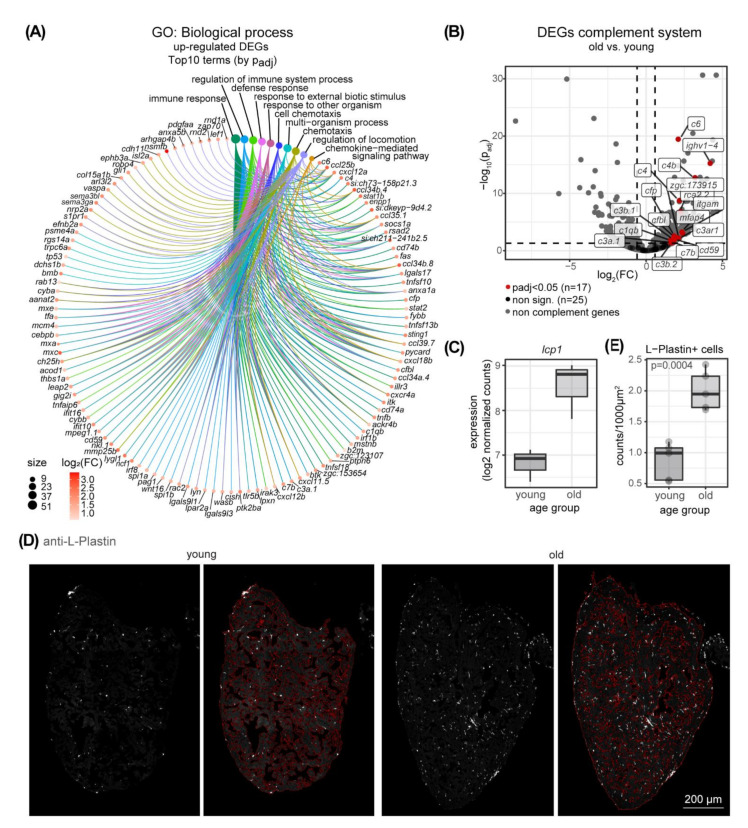
Figure 3
Expression of genes related to the immune system is changed upon aging. (A) Circular plot highlights the top 10 (by adjusted p-value) GO terms of the category “biological process” identified as enriched among 745 upregulated DEGs and the respective genes associated to these terms. The size of the GO term circle indicates the number of the genes and the color of the gene circle indicates the fold change (log2(FC)) in red shades. Immune system-related terms are prominent. (B) DEGs encoding components of the complement system are highlighted FC: fold change (C) Expression of the pan leukocyte marker gene lcp1 as log2 of normalized counts in young and old ventricles. n = 3. (D) Immunostaining of heart sections of old (37 months) and young (8 months) fish for the pan-leukocyte marker L-Plastin. The muscle tissue area that was segmented using ZEN Intellesis, is indicated in red in the respective right panels. Scale bar is 200 µm. (E) Quantification of L-Plastin-positive cells (from (D)) as counts per 1000 µm2 muscle area. n = 5; two-sample t-test p = 0.0004.