
|
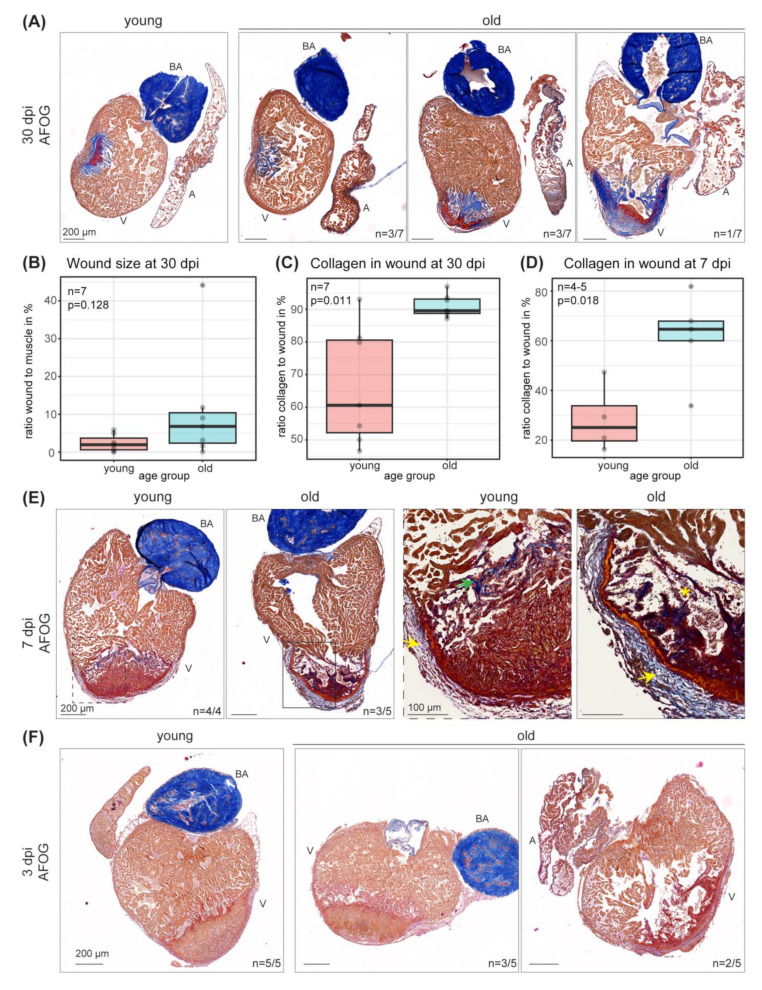
Figure 6
Wound size, regeneration response and collagen deposition changes upon cryoinjury in old compared to young hearts. (A) Acid fuchsin orange G (AFOG) staining of representative sections of young and old hearts 30 dpi visualizes the scar area in red (fibrin) and blue (collagen). Intact muscle is stained in orange. Scars display strong differences within the old (3 years 10 months) population as compared to young (1 year 4 months). 4 out of 7 old fish show differences in the injury response compared to young. Scale bars: 200 µm. (B) Quantification of the wound as percentage of intact muscle at 30 dpi (from (A)). n = 7. Wilcoxon rank sum test p = 0.128. (C) Quantification of collagen in wound (in %) at 30 dpi (from A). n = 7. Wilcoxon rank sum test p = 0.0111. (D) Quantification of collagen in wounds (in %) at 7 dpi (from (E)). n (young) = 4; n (old) = 5; two-sample t-test p = 0.0177. (E) AFOG staining of sections of young (1 year 2 months) and old (4 years 4 months) hearts 7 dpi visualizes the scar area. Scars display differences in young and old (3 out of 5 old). Yellow arrow points towards thickened collagen layer in the region of the epicard. Green arrow points towards collagen accumulation at the wound border in young. Yellow asterisk marks loosened muscle structure. Scale bars: 200 µm in overview and 100 µm in zoom-in. (F) AFOG staining of sections of young (9 months) and old (3 years 2 months) hearts 3 dpi visualizes the injured area. A subset of old animals (2 out of 5) show differences in the injury response. Scale bars: 200 µm. A: atrium; BA: bulbus arteriosus; V: ventricle. dpi: days post cryoinjury.