FIGURE SUMMARY
Title

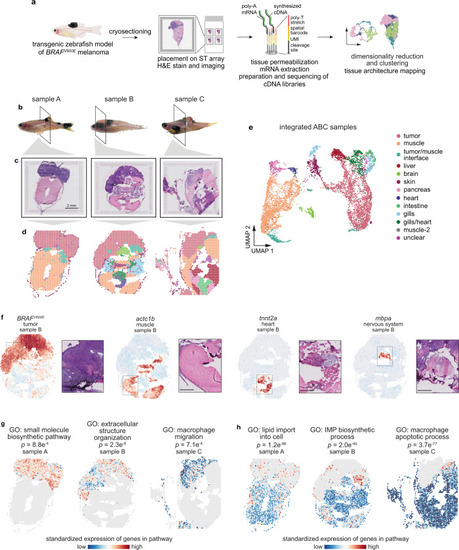
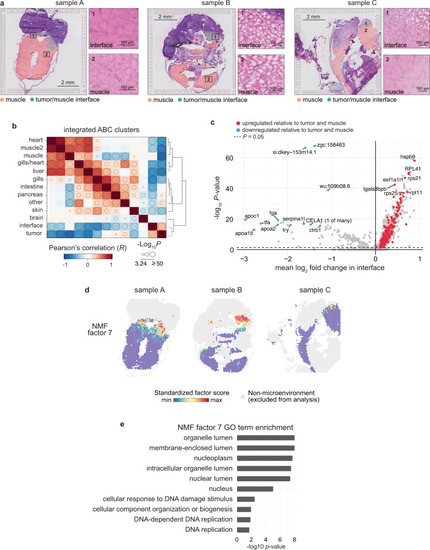
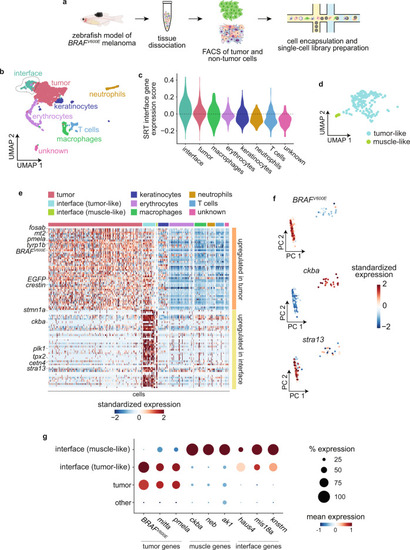
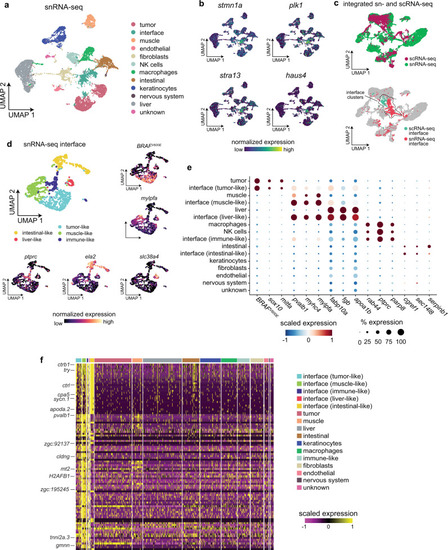
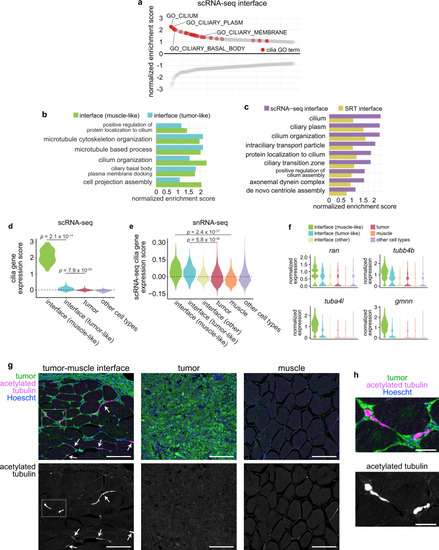
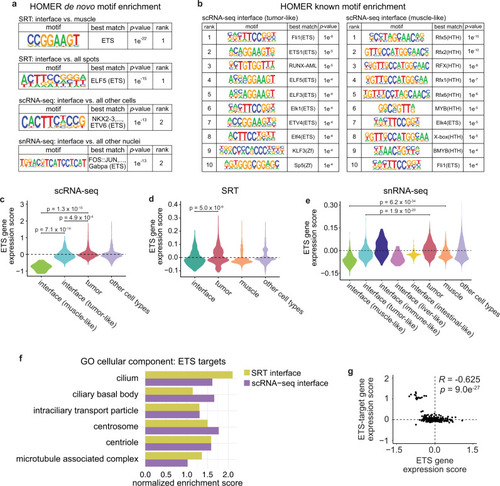
Spatially resolved transcriptomics reveals the architecture of the tumor-microenvironment interface

Authors
Hunter, M.V., Moncada, R., Weiss, J.M., Yanai, I., White, R.M.
Source
Full text @ Nat. Commun.

Spatially resolved transcriptomics reveals the transcriptional architecture of melanoma and its surrounding microenvironment.

a Schematic showing the spatially resolved transcriptomics (SRT) experiment workflow. b Images of zebrafish with BRAFV600E-driven melanomas used for SRT. The region where the fish were sectioned is highlighted. Scale bar, 2 mm. c H&E staining of cryosections used for SRT (n = 3 sections). d Visium array spots colored by clustering assignments of the integrated dataset (see “Methods” section). e UMAP embedding of SRT spots from all three samples colored by cluster assignments of the integrated dataset (see “Methods” section). f The expression of select marker genes (BRAFV600E, tumor; pvalb4, muscle; kcn6a, heart; mbpa, nervous system) from the SRT data projected over tissue space (left), with images of the corresponding histology from the indicated region of the SRT array (right). Scale bar, 500 µm. g, h Average, standardized expression of annotated genes for gene ontology (GO) terms displaying spatially-coherent expression patterns in the tumor (g) and microenvironment (h) regions in each sample. p-values represent the comparison between the distance between spots expressing that GO term genes and a null-distribution of distances between random spots (Wilcoxon’s Rank Sum test, two-sided).

The tumor–microenvironment interface is transcriptionally distinct from the surrounding microenvironment.

a Interface and muscle-annotated cluster spots projected onto tissue image (n = 3 sections). Insets show the tissue underlying the interface spots (1) and muscle spots (2). b Correlation matrix between average expression profile of SRT clusters across all three datasets. Clusters are ordered by hierarchical clustering of the Pearson’s correlation coefficients (see “Methods” section) and bubble sizes correspond to p-value (−log10) of correlation (two-sided), with p-values < 10−3 omitted. Clustering of tumor and interface together is highlighted in the dendrogram (red). c Volcano plot of differentially expressed genes between the interface cluster versus the muscle and tumor clusters. p-values were obtained from the Wilcoxon’s rank sum test (two-sided). d Non-negative matrix factorization (NMF) of the microenvironment spots (muscle and interface clusters). Shown are the standardized factor scores for interface-specific NMF factor 7, projected onto microenvironment spots. Arrows denote areas with higher factor scores. e Enriched GO terms for the top 150 scoring genes in NMF factor 7.

The tumor–microenvironment interface is composed of specialized tumor and muscle cells.

a Schematic showing scRNA-seq experiment workflow. b UMAP dimensionality reduction plot for 2889 cells sequenced as in a. Cluster/cell type assignments are labeled and colored. c Expression score per cell (scRNA-seq) for average expression of interface marker genes from the SRT interface cluster. d Inset of the outlined interface cluster in b showing the two interface subclusters. e Heatmap showing expression of the top 50 genes upregulated in the tumor cell cluster (top, orange) and interface cell cluster (bottom, yellow). Selected genes are labeled. f Principal component analysis of cells in the interface cluster, scored for expression of the tumor marker BRAFV600E, the muscle marker ckba, and the centromere gene stra13. Scores for principal components 1 and 2 are plotted. Cells are labeled by standardized expression of the indicated genes. g Dot plot showing expression of tumor and muscle markers. The size of each dot corresponds to the percentage of cells in that cluster expressing the indicated gene, and the color of each dot indicates the expression level.

Single-nucleus RNA-seq demonstrates that the interface cell states are distinct from the rest of the microenvironment.

a snRNA-seq cluster assignments plotted in UMAP space. b Expression of marker genes from the scRNA-seq interface cluster in the snRNA-seq dataset. c Integrated UMAP of the snRNA-seq and scRNA-seq datasets (labeled, top plot) showing colocalization of the two interface clusters (bottom plot). d Subcluster assignments and expression of marker genes from the snRNA-seq interface cluster. e Dotplot showing expression of microenvironment cell-type specific genes within the interface subclusters. f Heatmap showing expression of the top 100 genes upregulated across all of the interface subclusters.

Cilia genes and proteins are enriched at the tumor–microenvironment interface.

a Waterfall plot showing the top and bottom 250 GO cellular component terms by normalized enrichment score (NES) in the scRNA-seq interface cluster, with cilia GO terms labeled in red. b Cilia-related GO term enrichment scores within the tumor-like and muscle-like interface cell states from the scRNA-seq dataset. c Cilia-related GO term enrichment scores for the scRNA-seq and SRT interface clusters. d Relative expression of fish SYSCILIA genes in the scRNA-seq interface cluster. e Relative expression of the top 25 SYSCILIA genes upregulated in the scRNA-seq interface cluster across the snRNA-seq clusters. d, ep-values are noted (Wilcoxon rank sum test, two-sided, with Bonferroni’s correction). f Normalized expression of selected cilia genes across the snRNA-seq interface clusters. g Immunofluorescent images of sections through adult zebrafish with invasive melanomas, stained for GFP (tumor cells), acetylated tubulin (cilia), and Hoescht (nuclei), showing the tumor-muscle interface (left), center of the tumor (middle), and distant muscle (right). Arrows denote cilia at the interface. Scale bars, 100 µm. Images are representative from at least three independent experiments. h Inset of region highlighted in g (left). Scale bars, 25 µm.

ETS transcription factors may regulate cilia gene expression at the interface.

a Results from HOMER de novo motif analysis of differentially expressed genes in the SRT, scRNA-seq, and snRNA-seq interface clusters. b Top ten enriched motifs from HOMER known motif analysis of the scRNA-seq tumor-like (left) and muscle-like (right) interface cell states. a, bp-values calculated using the hypergeometric test (one-tailed). ce Relative expression of zebrafish ETS genes across the clusters in the scRNA-seq (c), SRT (d), and snRNA-seq (e) datasets. p-values are noted (Wilcoxon rank sum test, two-sided, with Bonferroni’s correction). f Normalized enrichment score of cilia-related pathways enriched in ETS-target genes within the SRT and scRNA-seq interface clusters. g Scatter plot comparing ETS gene expression scores per cell and ETS-target gene expression scores per cell in the scRNA-seq interface cluster. Pearson’s correlation coefficient (R) and p-value of correlation (two-sided) is indicated.

Acknowledgments
This image is the copyrighted work of the attributed author or publisher, and ZFIN has permission only to display this image to its users. Additional permissions should be obtained from the applicable author or publisher of the image. Full text @ Nat. Commun.