|
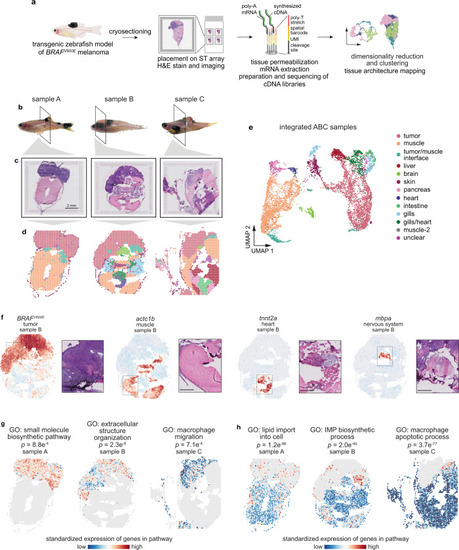
Spatially resolved transcriptomics reveals the transcriptional architecture of melanoma and its surrounding microenvironment.a Schematic showing the spatially resolved transcriptomics (SRT) experiment workflow. b Images of zebrafish with BRAFV600E-driven melanomas used for SRT. The region where the fish were sectioned is highlighted. Scale bar, 2 mm. c H&E staining of cryosections used for SRT (n = 3 sections). d Visium array spots colored by clustering assignments of the integrated dataset (see “Methods” section). e UMAP embedding of SRT spots from all three samples colored by cluster assignments of the integrated dataset (see “Methods” section). f The expression of select marker genes (BRAFV600E, tumor; pvalb4, muscle; kcn6a, heart; mbpa, nervous system) from the SRT data projected over tissue space (left), with images of the corresponding histology from the indicated region of the SRT array (right). Scale bar, 500 µm. g, h Average, standardized expression of annotated genes for gene ontology (GO) terms displaying spatially-coherent expression patterns in the tumor (g) and microenvironment (h) regions in each sample. p-values represent the comparison between the distance between spots expressing that GO term genes and a null-distribution of distances between random spots (Wilcoxon’s Rank Sum test, two-sided).
|