
- Title
-
Cooperation between liver-specific mutations of pten and tp53 genetically induces hepatocarcinogenesis in zebrafish
- Authors
- Luo, J., Lu, C., Feng, M., Dai, L., Wang, M., Qiu, Y., Zheng, H., Liu, Y., Li, L., Tang, B., Xu, C., Wang, Y., Yang, X.
- Source
- Full text @ J. Exp. Clin. Cancer Res.
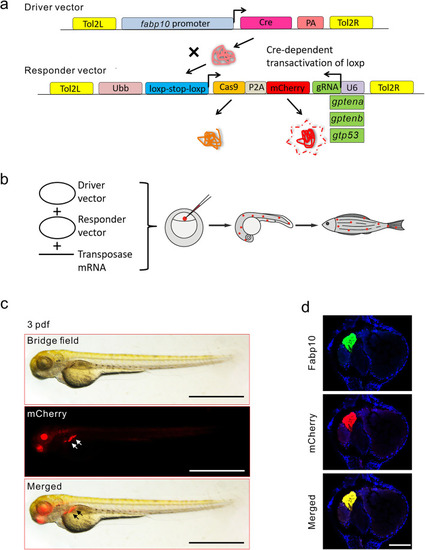
Generation of zebrafish with tissue-specific pten or tp53 deficiency. a The driver construct provides zebrafish fabp10 promoter-driven expression of Cre, which can bind to the loxp-stop-loxp cassette in the responder construct and activate the expression of Cas9-P2A-mCherry and the gRNA via the fabp10 and U6 promoters, respectively. The expression of Cas9 can be determined by mCherry fluorescence in zebrafish larvae. The driver and responder constructs are flanked by Tol2 transposon sites. b Strategy for the generation of transgenic zebrafish lines. The driver and responder constructs were mixed and injected with Tol2 mRNA to generate mosaic founder transgenic fish lines. c The phenotype of the F2 transgenic fabp10WT larvae at 3 dpf. Scale bars, 1 mm. d Colocalization of mCherry (red) and endogenous Fabp10 (green, FITC-labelled) expression in liver tissues of fabp10WT larvae at 3 dpf. Scale bars, 400 μm EXPRESSION / LABELING:
|
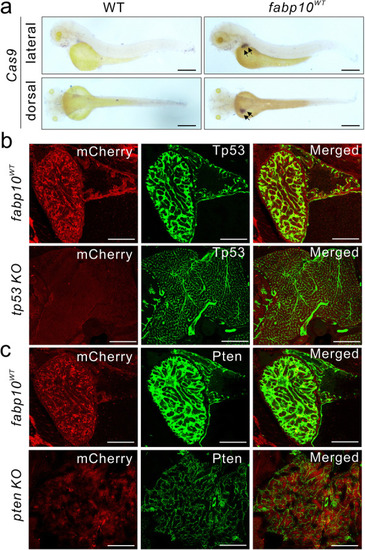
Disruption of tissue-specific Pten or Tp53 expression in larvae and mature zebrafish. a Representative images of whole-mount in situ hybridization using an anti-sense RNA probe against Cas9 mRNA in 3 dpf WT and fabp10WT larvae (black arrows). Scale bars, 500 μm. b, c Representative images of mCherry (red) and endogenous Tp53 or Pten (green, FITC-labelled) expression in liver tissues of 1-month-old tp53 KO, pten KO, and fabp10WT control fish. Scale bars, 50 μm EXPRESSION / LABELING:
PHENOTYPE:
|
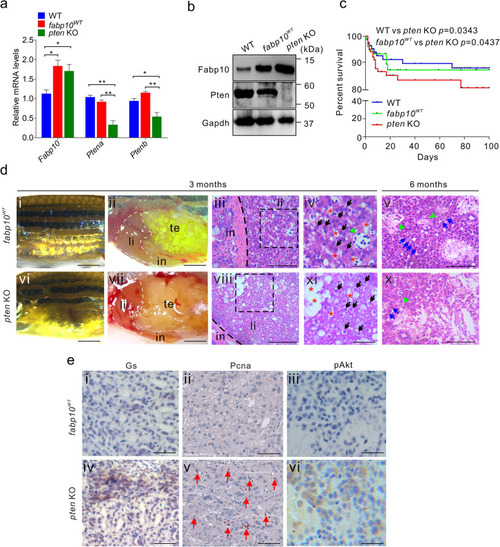
Pten mutagenesis in liver tissue disrupts liver morphology and initiates hepatocarcinogenesis. a Abundances of Ptena, Ptenb, and Fabp10 mRNA in liver tissues of WT, fabp10WT, and pten KO fish (n = 3 per group). b Western blot analyses of Pten and Fabp10 expression in the liver tissues of WT, fabp10WT, and pten KO fish (n = 3 per group). c Overall survival rates of WT, fabp10WT, and pten KO fish (n = 200 per group). d Gross morphology of 3-month-old fabp10WT (di) and pten KO fish (dvi). Representative bright field images of the internal abdominal organs, with the liver outlined, in 3-month-old fabp10WT (dii) and pten KO fish (dvii). in, intestine; li, liver tissues, sb, swim bladder. Histological examination of the liver tissues from fabp10WT (diii-dv) and pten KO fish (dviii-dx) at 3 and 6 months of age, respectively. Several typical hepatocarcinogenesis phenotypes were observed in 3- and 6-month-old pten KO fish, including abnormal lipid accumulation in hepatocytes (broken black boxes; Fig. 3diii, 3dviii), hepatocytes abnormal (black arrows; div, ix), disordered hepatic plates (blue arrows; dv, x), and veins disappearance (green arrowheads; dv, x). Scale bars, 100 μm. e Immunohistochemical staining was performed to examine the expression of several key tumour-related factors, including Gs, Pcna, and pAkt, in liver tissues from 3-month-old fabp10WT and pten KO fish. Scale bars, 100 μm. The data are shown as the mean ± SEM values. *p < 0.05, **p < 0.01 EXPRESSION / LABELING:
PHENOTYPE:
|
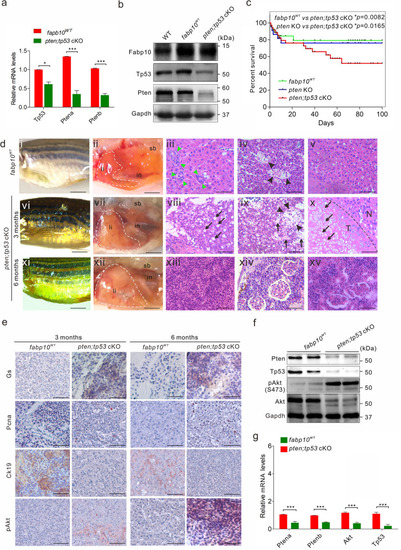
Mutation of tp53 is critical for the progression of hepatocarcinogenesis. a Abundances of Ptena, Ptenb, or Fabp10 mRNA in liver tissues of fabp10WT and pten;tp53 cKO fish (n = 3 per group). b Western blot analysis of Fabp10, Tp53, and Pten in liver tissues of WT, fabp10WT, and pten;tp53 cKO fish (n = 3 per group). c Overall survival rates of WT, fabp10WT, and pten;tp53 cKO fish (n = 200 per group). d Gross morphology of 3-month-old fabp10WT (di) and pten;tp53 cKO fish (dvi) and 6-month-old pten;tp53 cKO fish (dxi). Representative bright field images of the internal abdominal organs, with the liver outlined, in 3-month-old fabp10WT (dii) and pten;tp53 cKO fish (dvii) and 6-month-old pten;tp53 cKO fish (dxii). in, intestine; li, liver tissues, sb, swim bladder. Histological examination of liver tissues from fabp10WT and pten;tp53 cKO fish at 3 and 6 months of age, respectively. Several typical hepatocarcinogenesis phenotypes were observed in 3- and 6-month-old pten;tp53 cKO fish, including abnormal lipid accumulation in hepatocytes (black arrows, dviii), bile duct disappearance (green arrowheads, dviii-x), vascular disorder (black arrowheads, d9), variation in nuclear/cellular sizes (pleomorphism; dvii, viii), and tumour cell invasion into blood vessels (dxiii), the pancreas (dxiv), and the kidney (dxv). Scale bars, 100 μm. e Immunohistochemical staining was performed to examine the expression of Gs, Pcna, Ck19, and pAkt in liver tissues from 3- and 6-month-old fabp10WT and pten;tp53 cKO fish. Scale bars, 100 μm. f Western blot analyses were performed to confirm the expression of Pten, Tp53, pAkt, and Akt in liver tissues from 3-month-old fabp10WT (lanes 1–2) and pten;tp53 cKO fish (lanes 3–4). g Quantitative analysis of the protein expression ratio of pAkt and Akt in liver tissues from 3-month-old fabp10WT and pten;tp53 cKO fish. The data are shown as the mean ± SEM values. *p < 0.05, ***p < 0.001 EXPRESSION / LABELING:
PHENOTYPE:
|
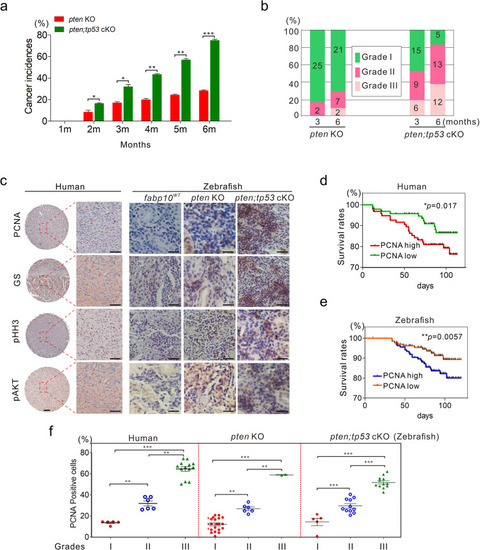
Histological and prognostic comparison of hepatocarcinogenesis between zebrafish and humans. a Tumour incidence rates in pten KO and pten;tp53 cKO fish (n = 100 per group with triplicates). The tumour incidence rates were confirmed by histological examination of dissected pten KO and pten;tp53 cKO fish at different time points. b Quantification of the malignancy of the tumours derived from fish with various mutations at 3 or 6 months of age. c Representative histological images indicating the expression of GS, PCNA, pHH3, and pAkt in tumours derived from humans and zebrafish with different mutations (fabp10WT, pten KO and pten;tp53 cKO fish). Scale bars, 100 μm. d, e PCNA expression was correlative with prognosis in HCC patients (n = 97, d) and pten;tp53 cKO fish (n = 100, e). f Correlation between PCNA expression and malignancy grade in HCC patients (n = 97), pten KO (n = 30), and pten;tp53 cKO fish (n = 28). The data are shown as the mean ± SEM values. *p < 0.05, **p < 0.01, ***p < 0.001 EXPRESSION / LABELING:
PHENOTYPE:
|

Blockade of Akt activation inhibits hepatocarcinogenesis in zebrafish. a Expression levels of Pten, Akt, and pAkt in liver tissues from 1-month-old fabp10WT, pten KO and pten;tp53 cKO fish. b Representative histological images of liver tissues from pten KO and pten;tp53 cKO fish treated with or without MK-2206. Scale bar, 100 μm. c Immunoreactivity of pAkt, Pcna, pHH3, and Gs in liver tissues from pten KO and pten;tp53 cKO fish treated with or without MK-2206. Scale bars, 100 μm. d Quantification of the percentages of Pcna-positive cells in liver tissues from pten KO and pten;tp53 cKO fish treated with or without MK-2206 (n = 10 random fields of view). e The tumour incidences were significantly suppressed by MK-2206 treatment in 3-month-old pten KO and pten;tp53 cKO fish. The data are shown as the mean ± SEM values EXPRESSION / LABELING:
PHENOTYPE:
|