
Fig. 3
|
Fig. 3
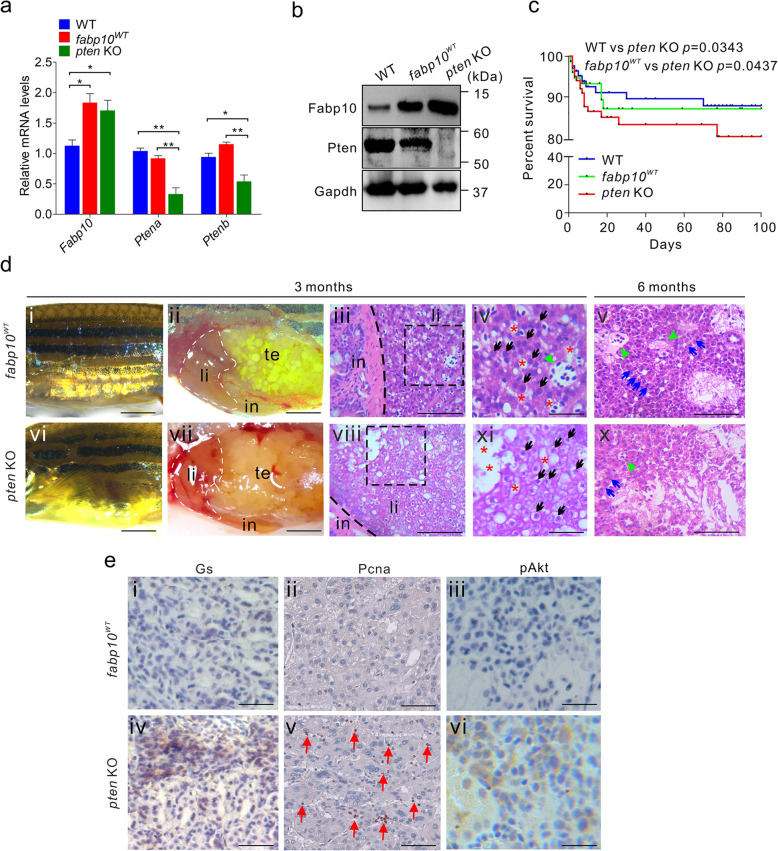
Pten mutagenesis in liver tissue disrupts liver morphology and initiates hepatocarcinogenesis. a Abundances of Ptena, Ptenb, and Fabp10 mRNA in liver tissues of WT, fabp10WT, and pten KO fish (n = 3 per group). b Western blot analyses of Pten and Fabp10 expression in the liver tissues of WT, fabp10WT, and pten KO fish (n = 3 per group). c Overall survival rates of WT, fabp10WT, and pten KO fish (n = 200 per group). d Gross morphology of 3-month-old fabp10WT (di) and pten KO fish (dvi). Representative bright field images of the internal abdominal organs, with the liver outlined, in 3-month-old fabp10WT (dii) and pten KO fish (dvii). in, intestine; li, liver tissues, sb, swim bladder. Histological examination of the liver tissues from fabp10WT (diii-dv) and pten KO fish (dviii-dx) at 3 and 6 months of age, respectively. Several typical hepatocarcinogenesis phenotypes were observed in 3- and 6-month-old pten KO fish, including abnormal lipid accumulation in hepatocytes (broken black boxes; Fig. 3diii, 3dviii), hepatocytes abnormal (black arrows; div, ix), disordered hepatic plates (blue arrows; dv, x), and veins disappearance (green arrowheads; dv, x). Scale bars, 100 μm. e Immunohistochemical staining was performed to examine the expression of several key tumour-related factors, including Gs, Pcna, and pAkt, in liver tissues from 3-month-old fabp10WT and pten KO fish. Scale bars, 100 μm. The data are shown as the mean ± SEM values. *p < 0.05, **p < 0.01