FIGURE SUMMARY
Title

Metabolic Alterations in Preneoplastic Development Revealed by Untargeted Metabolomic Analysis

Authors
Myllymäki, H., Astorga Johansson, J., Grados Porro, E., Elliot, A., Moses, T., Feng, Y.
Source
Full text @ Front Cell Dev Biol

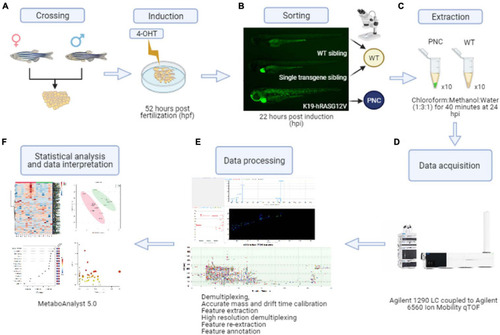
Preneoplastic cell (PNC) induction and schematic workflow for untargeted metabolomics from zebrafish larval skin. (A) Adult K19:Gal4 driver fish were crossed with UAS:RAS. Embryos were transferred to petri dishes containing 4-OHT induction solution at 52 hpf. (B) At 22 hpi larvae with eGFP positive skin cells were collected as the preneoplastic cell (PNC) group. Single transgene siblings (with a green heart but with GFP negative skin cells) and wild type siblings (negative for both green heart and skin cells) were collected as wild type sibling (WT) group. (C) Metabolite extractions were carried out at 24 hpi. (D) Metabolites were detected by liquid chromatography coupled to ion mobility mass spectrometry LC-MS-IMS instrumentation. (E) Data processing was performed using the Agilent MassHunter 10 software suite. Feature extraction was performed using Mass Profiler 10.0 on the demultiplexed raw data fist, and after High Resolution Demultiplexing prior to feature annotation. (F) Finally, statistical analysis and data interpretation was performed using the web-based software MetaboAnalyst 5.0.

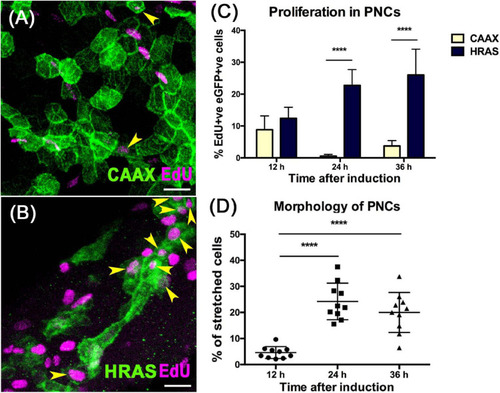
HRASG12V expressing PNCs show increased proliferation and altered morphology from 24 hpi. (A) Representative confocal image showing EdU labeling (Magenta) in skin cells expressing eGFPCAAX (Green) at 24 hpi. (B) Representative confocal image showing EdU labeling (Magenta) in skin cells expressing eGFPHRASG12V(Green) at 24 hpi. Yellow arrows indicate EdU+ve eGFP+ve cells, scale bar = 20 μm. (C) Graph showing increased proliferation in PNCs compared to eGFPCAAX expressing healthy skin cells 12 hpi (p = 0.057, n = 10); 24 hpi (p = 3.602e-011, n = 10), 36 hpi (p = 1,021e-07, n = 10), unpaired t-test with Holm-Sidak method for correction of multiple comparisons. (D) Assessing cell morphology shows that from 24 hpi, a significant proportion of PNCs have lost the normal polygonal shape and become elongated or developed long filopodia (one-way ANOVA with Tukey’s multiple comparisons test, ****p < 0.0001).

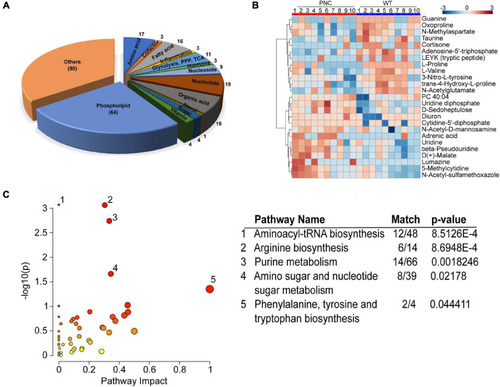
Metabolites extracted from zebrafish larval skin tissue. (A) Two-dimensional pie chart showing the distribution of 260 annotated metabolites assigned into compound classes using ClassyFire. The metabolites in each class are represented in the wedges and indicated with a number. (B) Heatmap generated using MetaboAnalyst 5.0 online platform showing the preneoplastic cell (PNC) and control (WT) groups for N = 10. The normalized relative abundance is presented in a gradient from blue (low) to red (high). (C) Scatter plot of Danio rerio KEGG metabolic pathways identified in the metabolomics dataset. The p-values from the pathway enrichment analysis are shown in darker color indicating more significant changes within a pathway, while the pathway impact values from the pathway topology analysis are depicted by the size of the node. Significantly (p < 0.05) impacted pathways are numbered and tabulated: 1, Aminoacyl-tRNA biosynthesis; 2, Arginine biosynthesis; 3, Purine metabolism; 4, Amino sugar and nucleotide sugar metabolism; 5, Phenylalanine, tyrosine and tryptophan biosynthesis. The match column shows the number of metabolites identified within the KEGG pathway.

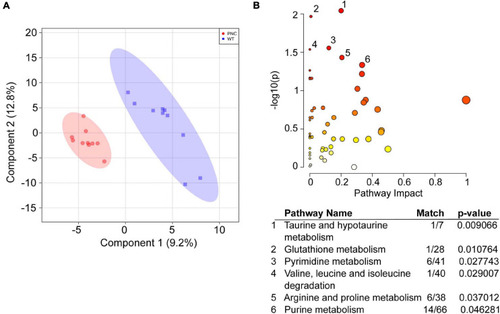
Metabolic pathways significantly altered upon HRASG12V induction in PNCs. (A) Partial Least Squares—Discriminant Analysis (PLS-DA) score plot shows separation of the preneoplastic cell (PNC) and control (WT) groups. The first and second components explain 9.2 and 12.8% of the variation, respectively. Different colors and shapes correspond to PNC, red circle and WT, blue square. (B) Scatter plot of Danio rerio KEGG metabolic pathways significantly altered upon HRASG12V induction. The p-values from the pathway enrichment analysis are shown in darker color indicating more significant changes within a pathway, while the pathway impact values from the pathway topology analysis are depicted by the size of the node. Significantly (p < 0.05) impacted pathways are numbered and tabulated: 1, Taurine and hypotaurine metabolism; 2, Glutathione metabolism; 3, Pyrimidine metabolism; 4, Valine, leucine and isoleucine degradation; 5, Arginine and proline metabolism; 6, Purine metabolism. The match values indicate the number of metabolites identified within the KEGG pathway.

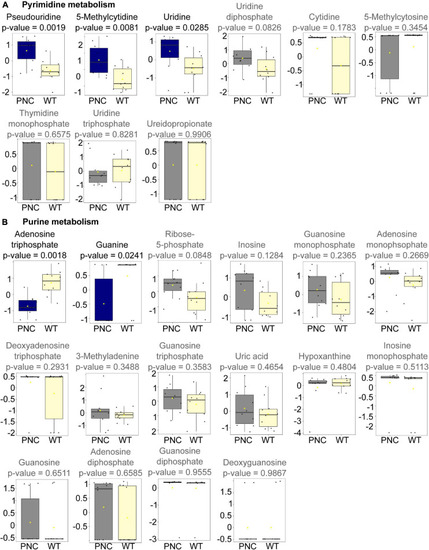
Metabolites significantly altered upon HRASG12V induction in PNCs. Box and whisker plots generated using MetaboAnalyst 5.0 online platform for individual metabolites in pyrimidine (A) and purine (B) metabolism identified in our dataset are presented with the statistically significant (p < 0.05) altered metabolites presented in blue and the non-significantly altered metabolites presented in gray. The boxplots represent median ± interquartile range of log transformed and auto-scaled intensities for preneoplastic cell (PNC) and control (WT) groups (N = 10).

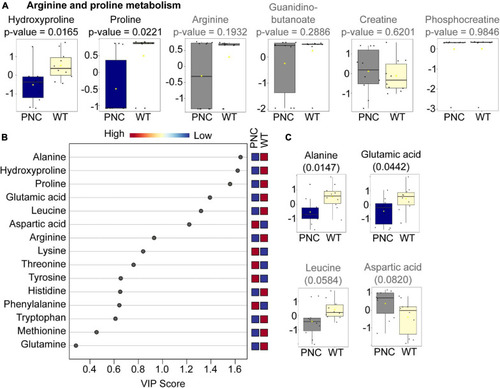
Amino acids significantly altered upon HRASG12V induction in PNCs. (A) Box and whisker plots generated using MetaboAnalyst 5.0 online platform for arginine and proline metabolism, identified using pathway enrichment analysis. (B) Variable importance in projection (VIP) plot generated using MetaboAnalyst 5.0 online platform for the 15 amino acids identified in our dataset. The relative abundance of each amino acid in the preneoplastic cell (PNC) and control (WT) groups are presented as colored boxes ranging from blue (low) to red (high). The average for N = 10 is presented. (C) Box and whisker plots for the four amino acids with a VIP cut-off score of 1, except hydroxyproline and proline presented in (A). The altered metabolites with statistical significance (p < 0.05) are presented in blue and the non-significant metabolites in gray. The boxplots represent median ± interquartile range of log transformed and auto-scaled intensities for preneoplastic cell (PNC) and control (WT) groups (N = 10).

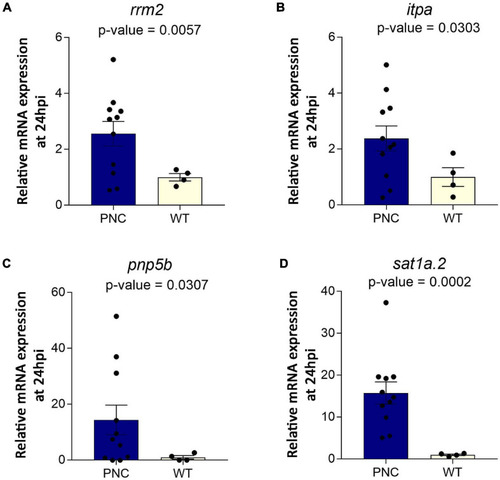
Upregulation of genes encoding metabolic enzymes at 24 h post HRASG12V induction in PNCs. Relative mRNA expression normalized to β-actin showing (A)rrm2 (p = 0.0057), (B)itpa (p = 0.0303), (C)pnp5b (p = 0.0307), and (D)sat1a.2 (p = 0.0002) expression was increased in PNCs. PNC N = 11, Control N = 4, Welsh’s t-test.

Acknowledgments
This image is the copyrighted work of the attributed author or publisher, and ZFIN has permission only to display this image to its users. Additional permissions should be obtained from the applicable author or publisher of the image. Full text @ Front Cell Dev Biol