FIGURE

FIGURE 2

ID
ZDB-FIG-210822-17
Publication
Myllymäki et al., 2021 - Metabolic Alterations in Preneoplastic Development Revealed by Untargeted Metabolomic Analysis
Other Figures
All Figure Page
Back to All Figure Page
FIGURE 2

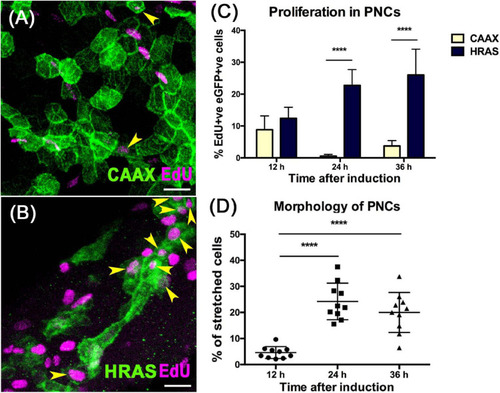
HRASG12V expressing PNCs show increased proliferation and altered morphology from 24 hpi. (A) Representative confocal image showing EdU labeling (Magenta) in skin cells expressing eGFPCAAX (Green) at 24 hpi. (B) Representative confocal image showing EdU labeling (Magenta) in skin cells expressing eGFPHRASG12V(Green) at 24 hpi. Yellow arrows indicate EdU+ve eGFP+ve cells, scale bar = 20 μm. (C) Graph showing increased proliferation in PNCs compared to eGFPCAAX expressing healthy skin cells 12 hpi (p = 0.057, n = 10); 24 hpi (p = 3.602e-011, n = 10), 36 hpi (p = 1,021e-07, n = 10), unpaired t-test with Holm-Sidak method for correction of multiple comparisons. (D) Assessing cell morphology shows that from 24 hpi, a significant proportion of PNCs have lost the normal polygonal shape and become elongated or developed long filopodia (one-way ANOVA with Tukey’s multiple comparisons test, ****p < 0.0001).

Expression Data

Expression Detail
Antibody Labeling
Phenotype Data

Phenotype Detail
Acknowledgments
This image is the copyrighted work of the attributed author or publisher, and ZFIN has permission only to display this image to its users. Additional permissions should be obtained from the applicable author or publisher of the image. Full text @ Front Cell Dev Biol