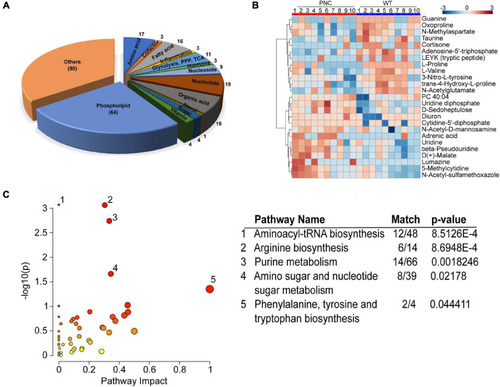
Metabolites extracted from zebrafish larval skin tissue. (A) Two-dimensional pie chart showing the distribution of 260 annotated metabolites assigned into compound classes using ClassyFire. The metabolites in each class are represented in the wedges and indicated with a number. (B) Heatmap generated using MetaboAnalyst 5.0 online platform showing the preneoplastic cell (PNC) and control (WT) groups for N = 10. The normalized relative abundance is presented in a gradient from blue (low) to red (high). (C) Scatter plot of Danio rerio KEGG metabolic pathways identified in the metabolomics dataset. The p-values from the pathway enrichment analysis are shown in darker color indicating more significant changes within a pathway, while the pathway impact values from the pathway topology analysis are depicted by the size of the node. Significantly (p < 0.05) impacted pathways are numbered and tabulated: 1, Aminoacyl-tRNA biosynthesis; 2, Arginine biosynthesis; 3, Purine metabolism; 4, Amino sugar and nucleotide sugar metabolism; 5, Phenylalanine, tyrosine and tryptophan biosynthesis. The match column shows the number of metabolites identified within the KEGG pathway.
|
