FIGURE

FIGURE 1

ID
ZDB-FIG-210822-16
Publication
Myllymäki et al., 2021 - Metabolic Alterations in Preneoplastic Development Revealed by Untargeted Metabolomic Analysis
Other Figures
All Figure Page
Back to All Figure Page
FIGURE 1

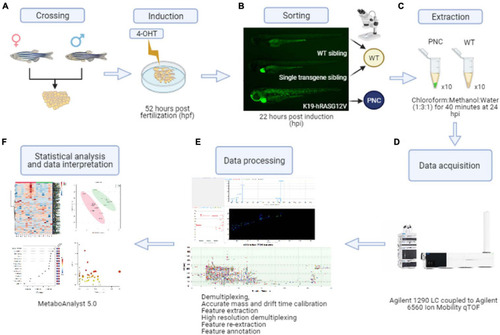
Preneoplastic cell (PNC) induction and schematic workflow for untargeted metabolomics from zebrafish larval skin. (A) Adult K19:Gal4 driver fish were crossed with UAS:RAS. Embryos were transferred to petri dishes containing 4-OHT induction solution at 52 hpf. (B) At 22 hpi larvae with eGFP positive skin cells were collected as the preneoplastic cell (PNC) group. Single transgene siblings (with a green heart but with GFP negative skin cells) and wild type siblings (negative for both green heart and skin cells) were collected as wild type sibling (WT) group. (C) Metabolite extractions were carried out at 24 hpi. (D) Metabolites were detected by liquid chromatography coupled to ion mobility mass spectrometry LC-MS-IMS instrumentation. (E) Data processing was performed using the Agilent MassHunter 10 software suite. Feature extraction was performed using Mass Profiler 10.0 on the demultiplexed raw data fist, and after High Resolution Demultiplexing prior to feature annotation. (F) Finally, statistical analysis and data interpretation was performed using the web-based software MetaboAnalyst 5.0.

Expression Data

Expression Detail
Antibody Labeling
Phenotype Data

Phenotype Detail
Acknowledgments
This image is the copyrighted work of the attributed author or publisher, and ZFIN has permission only to display this image to its users. Additional permissions should be obtained from the applicable author or publisher of the image. Full text @ Front Cell Dev Biol