IMAGE

FIGURE 4

ID
ZDB-IMAGE-210822-20
Source
Figures for Myllymäki et al., 2021
Image
Figure Caption

FIGURE 4

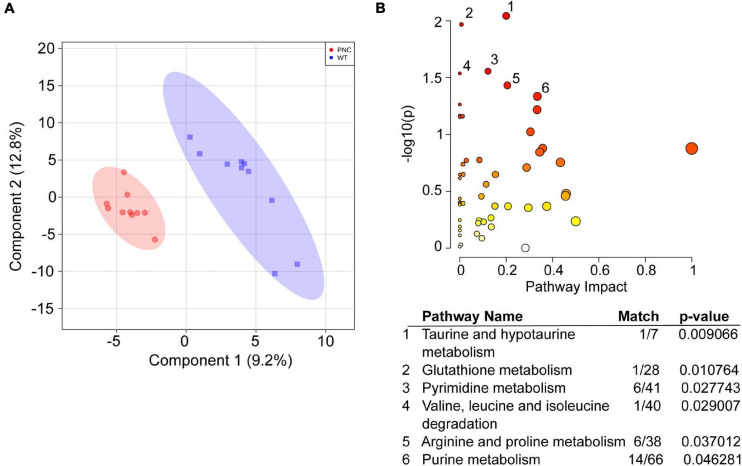
Metabolic pathways significantly altered upon HRASG12V induction in PNCs. (A) Partial Least Squares—Discriminant Analysis (PLS-DA) score plot shows separation of the preneoplastic cell (PNC) and control (WT) groups. The first and second components explain 9.2 and 12.8% of the variation, respectively. Different colors and shapes correspond to PNC, red circle and WT, blue square. (B) Scatter plot of Danio rerio KEGG metabolic pathways significantly altered upon HRASG12V induction. The p-values from the pathway enrichment analysis are shown in darker color indicating more significant changes within a pathway, while the pathway impact values from the pathway topology analysis are depicted by the size of the node. Significantly (p < 0.05) impacted pathways are numbered and tabulated: 1, Taurine and hypotaurine metabolism; 2, Glutathione metabolism; 3, Pyrimidine metabolism; 4, Valine, leucine and isoleucine degradation; 5, Arginine and proline metabolism; 6, Purine metabolism. The match values indicate the number of metabolites identified within the KEGG pathway.

Acknowledgments
This image is the copyrighted work of the attributed author or publisher, and ZFIN has permission only to display this image to its users. Additional permissions should be obtained from the applicable author or publisher of the image. Full text @ Front Cell Dev Biol