
Image
|
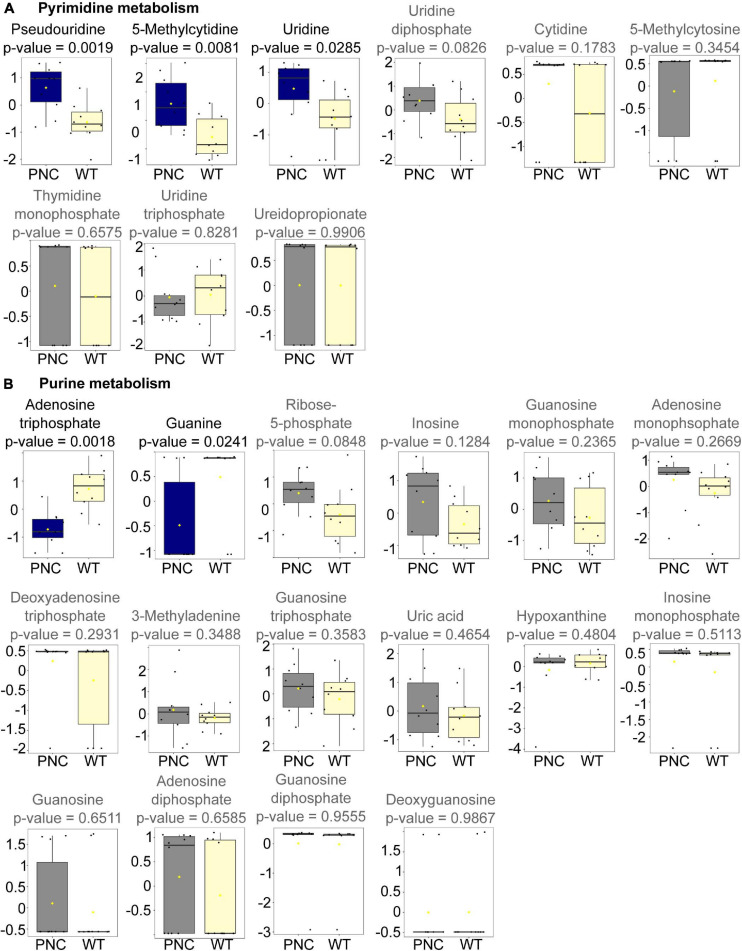
Figure Caption
FIGURE 5
Metabolites significantly altered upon HRASG12V induction in PNCs. Box and whisker plots generated using MetaboAnalyst 5.0 online platform for individual metabolites in pyrimidine
Figure Data
Acknowledgments
This image is the copyrighted work of the attributed author or publisher, and
ZFIN has permission only to display this image to its users.
Additional permissions should be obtained from the applicable author or publisher of the image.
Full text @ Front Cell Dev Biol