
- Title
-
Ongoing habenular activity is driven by forebrain networks and modulated by olfactory stimuli
- Authors
- Bartoszek, E.M., Ostenrath, A.M., Jetti, S.K., Serneels, B., Mutlu, A.K., Chau, K.T.P., Yaksi, E.
- Source
- Full text @ Curr. Biol.
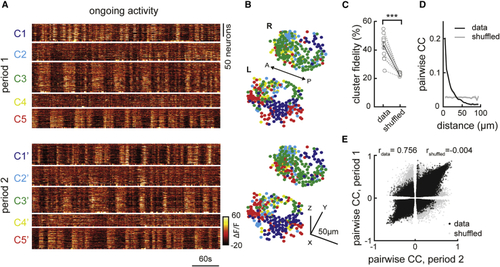
Ongoing activity of habenular neurons is temporally and spatially organized (A) Representative example of ongoing habenular activity recorded by two-photon calcium imaging in (B) Representative example of three-dimensional reconstruction of habenular neurons clustered using k-means clustering in two consecutive time periods (top and bottom). Neurons are color-coded based on their cluster identity that corresponds to the calcium signals depicted in (A). L, left; R, right hemisphere; A, anterior; P, posterior. (C) The ratio of habenular neuron pairs remaining in the same functional clusters (high cluster fidelity) is significantly higher than chance levels during two different time periods of ongoing activity. 315 ± 35 (mean ± SEM) habenular neurons were imaged in each fish (n = 11 fish). ∗∗∗p < 0.001, Wilcoxon signed-rank test. (D) Relation between pairwise correlation of habenular neurons during ongoing activity and the distance between each neuron pair. Gray line represents shuffled spatial distributions. (E) Pairwise correlations of calcium traces of habenular neurons (p < 0.05) during two consecutive time periods, in black. Gray dots represent pairwise comparison shuffled for pair identities. Actual data exhibit a correlation of rdata = 0.756 for the pairwise correlation across two time periods, indicating robust synchrony between pairs of neurons. Shuffled distribution is rs = −0.004. See also |
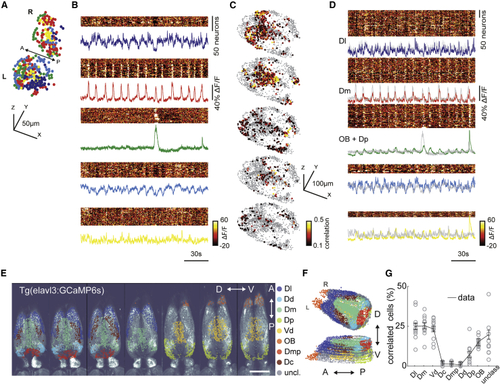
Ongoing activity of habenular neurons is correlated with sensory and limbic forebrain regions (A) Three-dimensional reconstruction of habenular neurons detected in (B) Ongoing activity of the habenular neurons corresponding to clusters in (A). Warm colors represent higher neural activity. Color-coded traces represent the average activity of all neurons in each cluster. (C) Three-dimensional reconstruction of forebrain neurons that are strongly correlated (Pearson’s correlation > 0.1) to average ongoing activity of different habenular clusters in (B). Warm colors represent stronger correlations. 2,135 ± 345 (mean ± SEM) forebrain neurons were imaged in each fish (n = 11 fish). (D) Ongoing activity of the forebrain neurons corresponding to clusters of neurons depicted in (C). Color-coded traces represent the average activity of neurons in each cluster. Gray traces represent the average activity of habenular clusters in (B). Note that the ongoing activity of identified forebrain neurons and habenular clusters is highly similar. (E) Forebrain regions identified based on anatomical landmarks are color coded and overlaid on raw two-photon microscopy image. Scale bar represents 100 μm. Optical planes are shown from dorsal to ventral. A, anterior; P, posterior; D, dorsal; V, ventral. (F) Three-dimensional reconstruction of forebrain regions shown in (E). (G) Distribution of forebrain neurons with strong correlation (>0.1) to ongoing habenular activity into anatomically identified forebrain regions. Dl, dorsolateral telencephalon; Dd, dorsal nucleus of the dorsal telencephalon; Dm, dorsomedial telencephalon; Dp, posterior zone of the dorsal telencephalon; Vd, dorsal nucleus of the ventral telencephalon; OB, olfactory bulb; Dmp, posterior nucleus of dorsomedial telencephalon; Dc, central zone of the dorsal telencephalon; unclass, unclassified. Black lines represent mean ± SEM (n = 11 fish). Each fish is presented as an open circle. Number of neurons detected in each brain region: Dl, 230 ± 35; Dd, 55 ± 9; Dm, 213 ± 33; Dp, 155 ± 24; Vd, 260 ± 40; OB, 273 ± 42; Dmp, 76 ± 12; Dc, 111 ± 17; unclassified, 774 ± 120; mean ± SEM. See also |
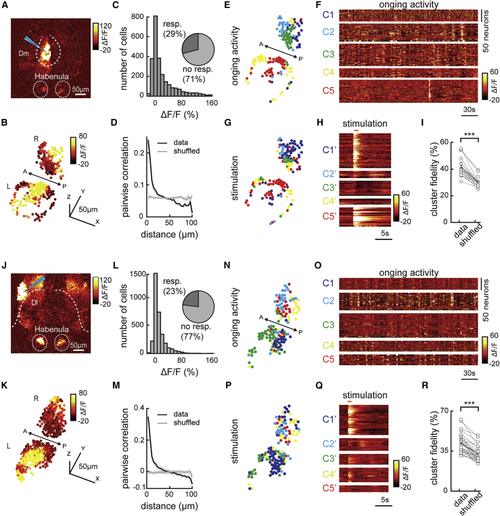
Electrical micro-stimulation of forebrain regions Dm and Dl activates spatially organized clusters of habenular neurons (A) Two-photon calcium signals upon electrical micro-stimulation of forebrain region Dm in (B) Reconstruction of habenular responses upon Dm micro-stimulation. (C) Histogram representing the responses of habenular neurons upon Dm micro-stimulation (511 ± 72 neurons per fish, in n = 5 fish). Pie chart represents the ratio of habenular neurons that are activated 2 SDs higher than baseline levels upon Dm micro-stimulation. (D) Relation between pairwise correlation of habenular neuron responses upon Dm micro-stimulation and the distance between each neuron pair. Gray line represents shuffled spatial distribution. (E) Reconstruction of habenular neurons clustered with k-means functional clustering of their ongoing activity in juvenile zebrafish brain explant. Colors represent habenular clusters with similar ongoing activity. Scale bar represents 50 μm. L, left; R, right hemisphere. (F) Ongoing activity of the habenular neurons corresponding to clusters in (E). (G) Reconstruction of habenular neurons clustered during Dm micro-stimulation using k-means clustering. Colors represent habenular clusters with similar responses to Dm micro-stimulation. L, left; R, right hemisphere. (H) Responses of habenular neurons upon Dm micro-stimulation clustered by k-means clustering. Forebrain micro-stimulations are marked in red. Warm colors represent higher neural activity. (I) The ratio of habenular neuron pairs remaining in the same functional clusters (high cluster fidelity) is significantly higher than chance levels during ongoing activity and Dm micro-stimulation. ∗∗∗p < 0.001, Wilcoxon signed-rank test. (J) Two-photon calcium signals upon electrical micro-stimulation of forebrain region Dl in (K) Reconstruction of habenular responses upon Dl micro-stimulation. (L) Histogram representing the responses of habenular neurons upon Dl micro-stimulation (575 ± 92 neurons per fish, in n = 6 fish). Pie chart represents the ratio of habenular neurons that are activated 2 SDs higher than baseline levels upon Dl micro-stimulation. (M) Relation between pairwise correlation of habenular neuron responses upon Dl micro-stimulation and the distance between each neuron pair. Gray line represents shuffled spatial distribution. (N) Reconstruction of habenular neurons clustered with k-means functional clustering of their ongoing activity in juvenile zebrafish brain explant. Colors represent habenular clusters with similar ongoing activity. L, left; R, right hemisphere. (O) Ongoing activity of the habenular neurons corresponding to clusters in (N). (P) Reconstruction of habenular neurons clustered during Dl micro-stimulation using k-means clustering. Colors represent habenular clusters with similar responses to Dl micro-stimulation. L, left; R, right hemisphere. (Q) Responses of habenular neurons upon Dl micro-stimulation clustered by k-means clustering. Forebrain micro-stimulations are marked in red. (R) The ratio of habenular neuron pairs remaining in the same functional clusters (high cluster fidelity) is significantly higher than chance levels during ongoing activity and Dl micro-stimulation. ∗∗∗p < 0.001, Wilcoxon signed-rank test. See also |
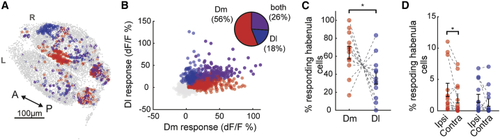
Activating Dm and Dl recruits partially overlapping but different sets of habenular neurons (A) Representative example of three-dimensional forebrain reconstruction in (B) Responses of 8,703 individual habenular neurons to Dm (red) and Dl (blue) stimulation or both (magenta) in 12 experiments. Pie chart represents the ratio of habenular neurons responding at least one stimulation, 2 SDs above baseline levels. (C) Fraction of responding habenular neurons (above 2 SDs) activated by Dm (red) and Dl (blue) stimulations in the same brain explant, n = 12. Note that significantly lager fraction of habenular neurons responds to Dm stimulation compared to Dl stimulation (∗p < 0.05, tailed Wilcoxon signed-rank test). (D) Ratio of neurons in each habenular hemisphere activated by the stimulation of Dm (red) and Dl (blue) regions that are located in ipsilateral versus contralateral hemispheres. While Dm stimulation recruits a significantly larger fraction of neurons in ipsilateral hemisphere, Dl stimulation recruits a similar fraction of neurons in both habenular hemispheres (∗p < 0.05, tailed Wilcoxon signed-rank test). See also |
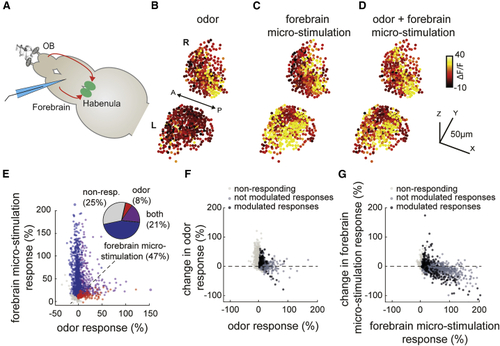
Habenular neurons integrate inputs from limbic dorsal forebrain regions and olfactory system in a non-linear manner (A) Schematic representation of nose-attached brain-explant preparation in (B) Three-dimensional reconstruction of habenular responses to odor stimulation averaged over 6 trials. Warm colors indicate stronger neural responses. L, left; R, right hemisphere. (C) Three-dimensional reconstruction of habenular responses to dorsal forebrain micro-stimulation averaged over 6 trials. (D) Three-dimensional reconstruction of habenular responses to simultaneous odor stimulation and dorsal forebrain micro-stimulation averaged over 6 trials. (E) Responses of individual habenular neurons to odor stimulation and dorsal forebrain micro-stimulation from 2,550 neurons measured in n = 5 fish. Pie chart represents the ratio of habenular neurons responding 2 SDs above baseline levels to only odors (red), only micro-stimulation (blue), and both (magenta). (F) Change of odor responses in habenular neurons upon dorsal forebrain stimulation. Dark gray marks habenular neurons responding to odor stimulation. Black marks habenular neurons responding to odor stimulation and that are significantly (p < 0.05, Wilcoxon signed-rank test) modulated by forebrain micro-stimulation. (G) Change of habenular neuron responses to dorsal forebrain activation upon odor stimulation. Dark gray marks habenular neurons responding to dorsal forebrain micro-stimulation. Black marks habenular neurons responding to dorsal forebrain micro-stimulation and that are significantly (p < 0.05, Wilcoxon signed-rank test) modulated by the presentation of odors. See also |
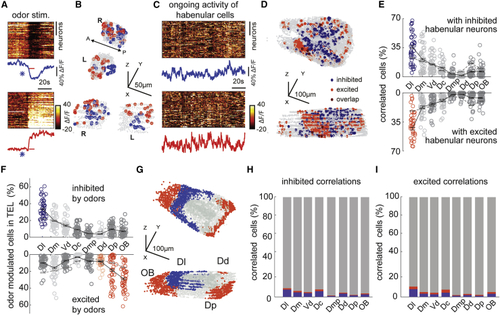
Odor-modulated habenular neurons are functionally connected with limbic dorsal forebrain regions during ongoing activity (A) Representative example of habenular responses to the odor stimulation recorded by two-photon calcium imaging in (B) Representative example of three-dimensional reconstruction of top 5% odor inhibited (blue) and excited (red) habenular neurons from an individual fish. 916 ± 39 (mean ± SEM) habenular neurons were imaged in n = 10 fish. (C) Ongoing neural activity of odor-inhibited (top) and odor-excited (bottom) habenular neurons in (B). Lines represent the average ongoing activity of odor-inhibited (blue) and odor-excited (red) habenular neurons. (D) Representative example of three-dimensional reconstruction of top 5% forebrain neurons that are correlated with the ongoing activity of odor-inhibited (blue) and odor-excited (red) habenular neurons. 5,799 ± 165 (mean ± SEM) forebrain neurons were imaged in n = 10 fish. (E) Anatomical distribution of forebrain neurons with strong correlations (top 5%) to ongoing activity of habenular neurons that are inhibited (top) and excited (bottom) by odors. Red and blue colored circles highlight those forebrain regions that exhibit significantly higher synchrony to habenular neurons than the shuffled chance levels dictated by the size of individual regions. p < 0.01, Wilcoxon signed-rank test. Black lines represent mean ± SEM (n = 10 fish). Dl, dorsolateral telencephalon; Dd, dorsal nucleus of the dorsal telencephalon; Dm, dorsomedial telencephalon; Dp, posterior zone of the dorsal telencephalon; Vd, dorsal nucleus of the ventral telencephalon; OB, olfactory bulb; Dmp, posterior nucleus of dorsomedial telencephalon; Dc, central zone of the dorsal telencephalon. (F) Anatomical distribution of forebrain neurons that are most (top 5%) inhibited (top) and most excited (bottom) by odors. Colored circles highlight those forebrain regions that exhibit significantly higher number of odor-inhibited (blue) and odor-excited (red) neurons than the shuffled chance levels dictated by the size of individual regions. p < 0.01, Wilcoxon signed-rank test. Black lines represent mean ± SEM (n = 10 fish). Dl, dorsolateral telencephalon; Dd, dorsal nucleus of the dorsal telencephalon; Dm, dorsomedial telencephalon; Dp, posterior zone of the dorsal telencephalon; Vd, dorsal nucleus of the ventral telencephalon; OB, olfactory bulb; Dmp, posterior nucleus of dorsomedial telencephalon; Dc, central zone of the dorsal telencephalon. (G) Three-dimensional representation of forebrain regions that show significantly higher number of odor-inhibited (blue) and odor-excited (red) neurons than the shuffled chance levels dictated by the size of individual regions as in (F). Dl, dorsolateral telencephalon; Dd, dorsal nucleus of the dorsal telencephalon; Dp, posterior zone of the dorsal telencephalon; OB, olfactory bulb. (H) Overlap of odor-responding (blue, inhibited; red, excited) neurons in each forebrain region and forebrain neurons that drive odor-inhibited habenular neurons. (I) Overlap of odor-responding (blue, inhibited; red, excited) neurons in each forebrain region and forebrain neurons that drive odor-excited habenular neurons. See also |